
Trending

It’s widely known that the wealth management is playing a leading role when it comes to the growth of exchange traded funds (ETFs) as advisors have allocated trillions of dollars of client assets to ETFs over the years.
Count low fees, tax efficiencies and transparency among the reason why ETF adoption among advisors is soaring and is seemingly unrelenting. Of course as is the case with nearly everything else in investing, where there are winners, there are also losers. In this case, the losers are mutual funds. As in advisors have long been pulling client capital from open-end mutual and reallocating it to ETFs.
That movement isn’t an indictment of active management. In fact, ETFs, particularly fixed income funds, are breathing new life into active management. So it’s fair to say the advisors prefer the ETF structure, but that preference isn’t linear. There are some market segments where advisors’ preference for ETFs is greater than others. Let’s examine some of the most prominent ones below.
Advisors Love Large-Cap ETFs
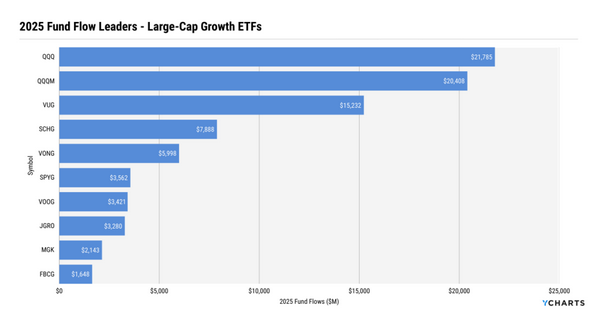
There are corners of the equity market where some active managers have extended records of success, including smaller stocks. However, it’s incredibly difficult for large-cap active managers to consistently beat benchmarks such as the Russell 1000 and the S&P 500, explaining why advisors flock to large-cap core and growth ETFs, the bulk of which are passive products. That trend was on display last year.
“Large-Cap Growth mutual funds saw $133.3B in outflows, while ETFs absorbed $92.7B in inflows, a $225.9B swing toward ETFs. ETFs now hold $1.2T of the category’s $3T total AUM, meaning roughly 39% of Large-Cap Growth assets now sit in ETFs,” according to YCharts.
A similar trend played out with both large- and multi-cap core ETFs last year. For example, multi-cap core mutual funds shed $49.8 billion in assets while comparable ETFs hauled in $56.6 billion, notes YCharts. The advantage for large-cap core ETFs was more pronounced.
“Advisors pulled $90.4B from Large-Cap Core mutual funds while allocating $66B to ETFs, producing a $156.3B ETF advantage in 2025. ETFs now account for $536B of the $1.8T category ($536B ETF vs. $1.3T mutual), or about 30% of total AUM,” adds YCharts.
Dividend, International Equity ETFs Taking Cash from Mutual Funds, Too
With 2025 marking a resurgence by international stocks, it’s not surprising advisors went to the ETF well and they did just that to the tune of $71.3 billion of inflows into international multi-cap core ETFs. Conversely, wealth managers yanked $24.2 billion from comparable mutual funds, according to YCharts data.
Despite being somewhat out of fashion due to ongoing leadership by domestic mega-cap growth stocks, advisors didn’t abandon equity income (dividend) ETFs last year. Rather, they allocated $29 billion to those products while pulling much more from equivalent mutual funds.
“Equity Income mutual funds experienced $53.8B in outflows, while ETFs attracted $29B, creating an $82.8B ETF advantage. ETFs now hold $478B of $953B in category assets, meaning just over 50% of Equity Income AUM now sits in ETFs,” says YCharts.
Emerging markets and multi-cap value are two more segments where in 2025, ETF inflows were measured in the tens of billions of dollars while the same was true of mutual fund outflows.
Related: CAIE: Making the Auto Call for a Better Way to Income