
Trending

The recent theatrics among semi stocks offer a cautionary tale for those inclined to chase parabolas. The larger the advance, the more seductive the participation, the higher the leverage and the more punitive the pending reset—Situational Awareness, discussed below, offers a case in point. At this scale, flash declines and hedge fund blow ups can badly bruise investor confidence referencing volatility as a market top marker. As contrarians, we welcome the comeuppance. Cooling overheated asset classes without freezing overall returns should add encouragement, not anxiety. A market rising to new highs despite a subset hitting hard lows must have significant fundamental support, or elevated conceit—leading us to question whether we can justify these… new highs.
The Full Story
My greatest personal challenge in producing Outlook and Halftime reports is the blackout period between contemplation and distribution. We produced the content for 2026’s Halftime Report mid-June and shared it with you mid-July. In today’s histrionic market, a muzzled month can feel like a lifetime! Fortunately, our forecasts that the overblown semiconductor trade would burst without blowing up the market overall appear to have played out:
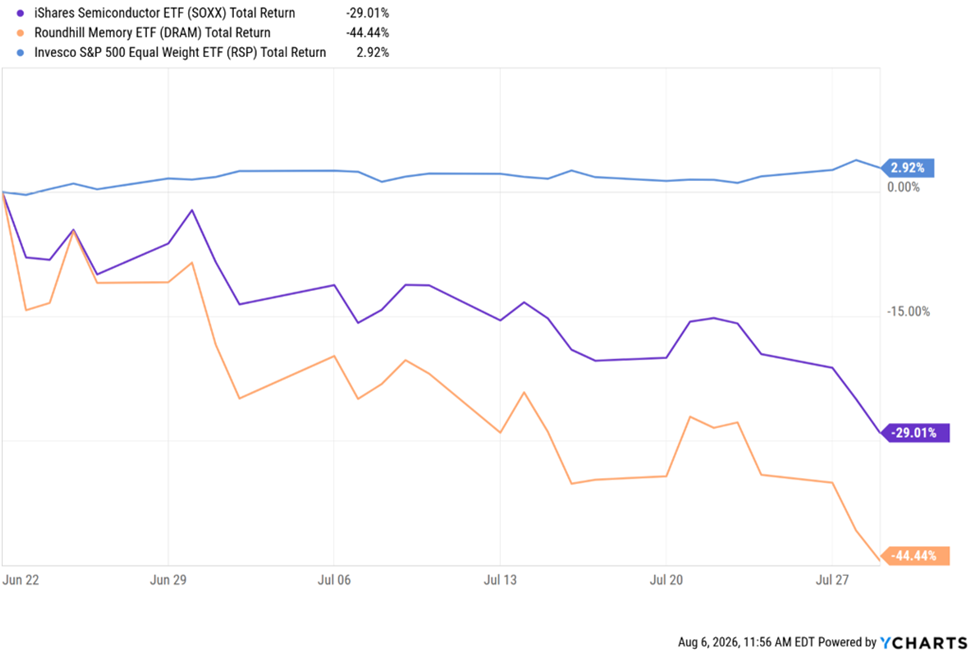
Source: ETF total returns are shown for the period indicated and are for illustrative purposes only.
ETF performance does not represent the performance of any client account or investment strategy.
Past performance is not indicative of future results.
Between June 22 and July 29, overheated semiconductor stocks (ETF: SOXX) and memory stocks (ETF: DRAM) lost 29% and 44%, respectively. These rival major reversals observed during panics and recessions! And yet, over the same period the equal-weight S&P 500 (ETF: RSP) rose nearly 3%. While it is gratifying to see our expectations play out, it pleases me far more to see a market that can punish a group of stocks with precision while rising with continued conviction. The implosion of Situational Awareness, a giant technology hedge fund, punctuated the tech decline and cleared the market for reappraisal. Note the spirited recovery since Situational Awareness’s liquidation:
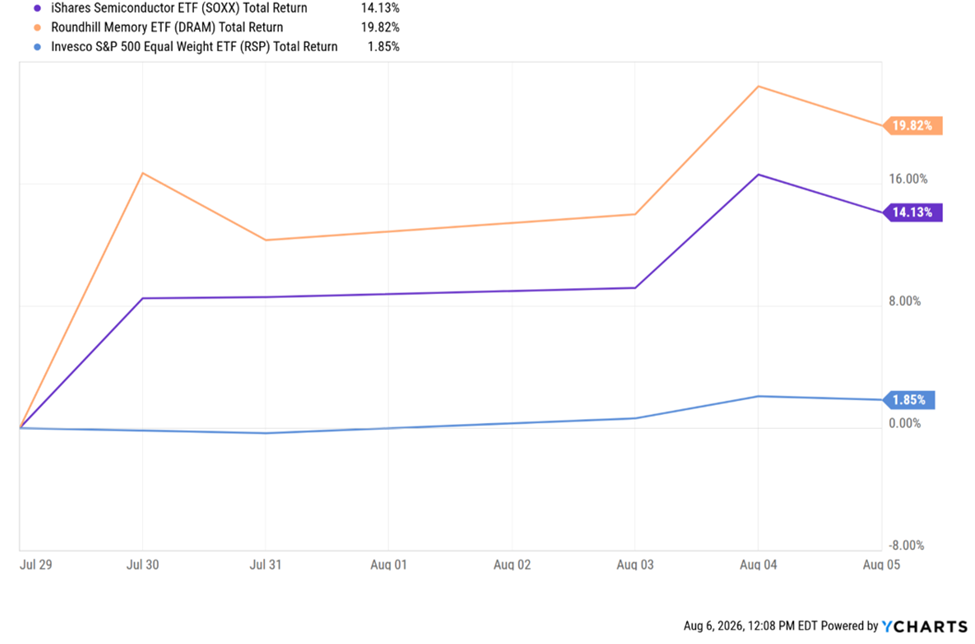
Source: ETF total returns are shown for the period indicated and are for illustrative purposes only. ETF performance does not represent the performance of any client account or investment strategy. Past performance is not indicative of future results.
These dramatic moves have little to do with company fundamentals and everything to do with marketplace mechanics, explaining the 14% and 20% rallies in Semis and Memorys since SA’s collapse. Note that this recovery still doesn’t reclaim the losses as both sit 17% and 37% below their highs, respectively. Nonetheless, their rapid ascent does instill some confidence that this was a repricing event rather than a reckoning event. Lastly, and more subtly, note that the broader market equal weight S&P 500 index (ETF: RSP) that rose 3% during the rout, added another 2% during the recovery, continuing to string together new highs. Which leads us to question: with all the bubblish behavior about, are new highs justifiable?
The Economy
We received a first look at second quarter GDP last week. While the headline figure of 1.5% growth seemed weak, the parts within the sum exhibited strength:
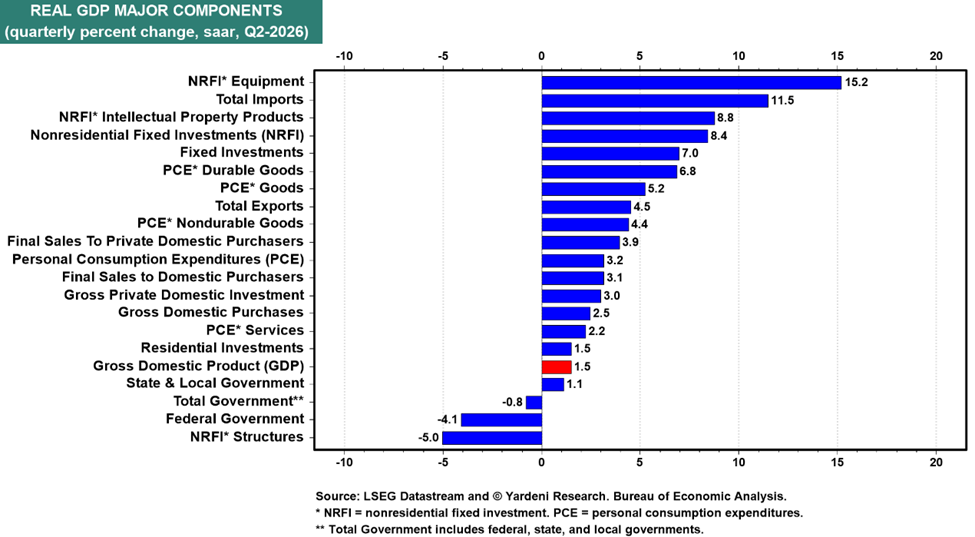
Economic data is provided for informational purposes only and should not be construed as investment advice or a guarantee of future results.
Unsurprisingly, the AI Boom continued to power GDP growth within the quarter. Tech equipment, tech imports (which detract from GDP growth), and tech IP grew between 9% and 15% at an annualized rate as seen above. In fact, overall, the AI Boom once again contributed over half of overall GDP growth. However, consumers did re-emerge last quarter as consumption rose a healthy 3.2%. Counting investment and consumption alone GDP would have risen 2.65%. So, while 1.5% isn’t exciting, robust readings from investment and consumption activity offset by more volatile import and government activities may bode well for future reports and lowered recession odds on the year to near zero.
The Earnings
According to FactSet, earnings for the S&P 500 will have grown 47% in Q2. If these numbers seem fanciful, we agree. Earnings generally advance at this pace bouncing out of recessions or if accounting oddities appear. We believe the current environment reflects the latter. Hyperscalers like Alphabet and Amazon have large equity positions within SpaceX and Anthropic that they have marked up with high multiples that exaggerate earnings. However, excluding the mark ups, earnings for the quarter will still have grown more than 20%. As a rule, when questioning earnings quality simply default to revenue reviews for purification.
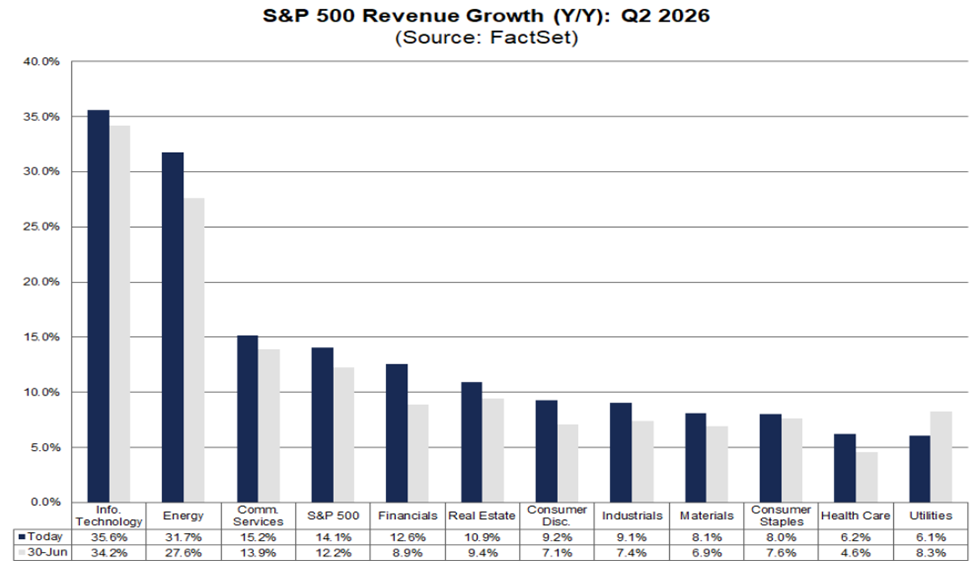
Nothing unworthy here! Overall, 77% of reporting companies have produced upside revenue surprises. In fact, 10 of 11 sectors within the S&P have produced higher revenues than anticipated on June 30. At 14.1%, S&P 500 companies grew revenue faster last quarter than any other quarter since Q4 2021 as the economy was resurging post-pandemic. What accounts for the superlative growth rates for revenues and earnings? Yesterday’s stockpiled/distributed free cash flows have become today’s reinvestments, boosting corporate revenues and earnings across the economy. Analysts continue to revise forward revenue estimates into 2027… higher.
The Valuation
The tech price drawdown last month, paired with the index earnings drawup, has greatly reduced valuations overall. Consider our current condition: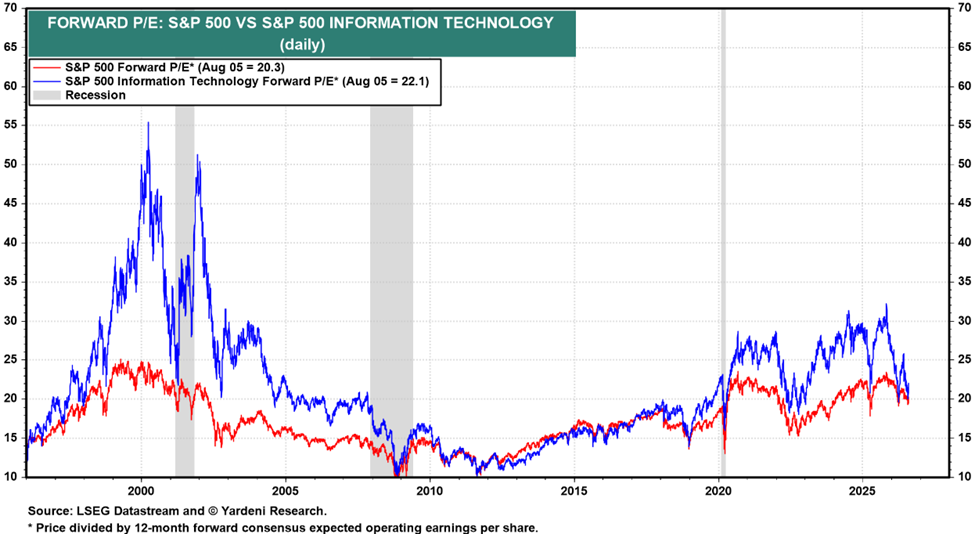
For comparison, the IT Sector forward P/E topped out at 55x in early 2000 compared with a rather pedestrian 22x today, while the S&P 500 overall topped out near 25x in early 2000 compared with 22x today. Not only do these valuations appear justifiable relative to themselves they also appear justifiable relative to Treasury yields of 4.6% today vs. 6%+ then. While the AI Boom may have created an earnings bubble, it does not appear to have created a valuation bubble.
The Justification
Resilient economic growth, ebullient earnings growth, and valuation validations make the current string of new highs… justified!*
Now relax and enjoy your last few beach days of 2026!
Related: The AI Bear Case Has Three Arguments. Only Two Hold Up.