
Trending

Written by: Meera Pandit
The S&P 500 notched 24 new all-time highs in Q1, up 10.6%, with 2.7%-points from earnings, 7.4% from multiple expansion, and 0.4% from dividends. Yet, valuations are at 21.0x, more than one standard deviation above the 30-year average of 16.6x. Given already stretched valuations and unbridled enthusiasm for equities, can multiples continue to drive returns?
Since 1989, earnings growth has driven 56% of returns, compared to just 25% for multiple expansion and 19% for dividends. However, by calendar year, in 18 of the last 35 years, the contribution from multiple expansion outpaced the earnings growth contribution. One of three dynamics was typically at play:
- Earnings contraction: In 7 of the 18 years, earnings were contracting while multiples either also suffered (2001, 2008) or began to rebound (2009, 2020), as multiples typically lead earnings in a recovery.
- Multiples recovery: In 5 of the 18 years, multiples rebounded from contractions the prior year (1991, 1995, 2012, 2019, 2023). Notably several of those instances were when the Fed pivoted and/or began cutting rates.
- Optimistic investor sentiment: In 6 out the 18 years, multiples and earnings had very strong contributions to double-digit total returns, up a whopping 27% on average and reaching an average of 47 new all-time highs within the year. The period from 1996-1998 was marked by a supportive macro backdrop, but also heady enthusiasm around internet stocks and pronounced market concentration. On the other hand, 2013-2014 had an improving macro backdrop and steady earnings growth without the excess and weathered the beginning of an oil plunge.
This time around, although earnings were roughly flat last year, multiples had already recovered in 2023, so this year thus far appears to be multiple expansion based on optimistic investor sentiment. Indeed, the macro backdrop is supportive, with U.S economic growth still solid, inflation gradually receding, and Fed rate cuts expected.
However, markets are also redolent of a whiff of dissonant exuberance, with both risk-on (U.S., Japanese, European equities) and risk-off (gold) assets reaching new all-time highs and rising speculative assets (crypto) alongside continued inflows into money market funds. However, even if negative catalysts emerge that impact sentiment and multiples, profit growth is expected to accelerate from 0% last year to 11% this year, so earnings growth could reliably drive equity performance as it has on average for the last three decades.
Sources of S&P 500 calendar year returns
Total returns, 1989-1Q24
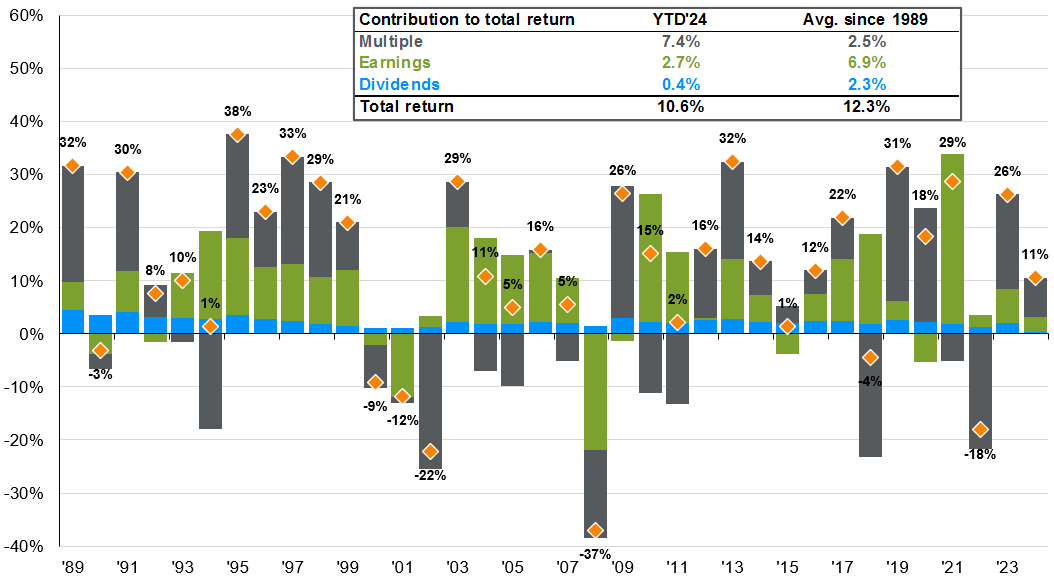
Sources: IBES, FactSet, J.P. Morgan Asset Management. EPS contribution is calculated using implied EPS. Multiple contribution uses NTM P/E ratios, which are sourced from IBES for 1988 - 2021 and FactSet thereafter. Data are as of March 31, 2024.
Related: Would Fed Rate Cuts Benefit Emerging Market Equities?