
Trending

Written by: David Waddell | Waddell and Associates
THE BOTTOM LINE:
Donald Trump entered the year with a set of objectives and has so far accomplished many. Border crossings have fallen, inflation has fallen, interest rates have fallen, the US dollar has fallen, tariff revenues have risen, and stocks have overcome the “Liberation Day” sell-off, having now risen on the year. From here, Trump needs tax cuts, regulatory cuts, economic acceleration, and new stock market highs to complete his check list. I reference this list of Trump’s agenda successes not as an endorsement, but as a reminder to investors that, while Trump’s methods seem insane, his results stand remarkably consistent with his objectives. I do not think the focus on Trump is wholly misguided given that his outsized level of influence on sentiment and policy looms large. However, the pro-market expectations that powered the stock market rally from election day to inauguration day found reprisal during the most recent V-shape reversal. Markets have apparently built up a newfound tolerance for Trump’s tactics and a newfound awareness of the results.
This past week, I had a reporter ask me if the economy and markets had behaved differently than I expected under President Trump so far this year. I responded quickly with a surprisingly emphatic “no”. While his methods win no style points, his results largely align with his objectives. Given my surprisingly emphatic response, I took to the data to prove my impressions. Here is what I found:
Objective: Stop Illegal Immigration

Result:
Trump’s elimination of asylum and decisive efforts to close the southern border have reduced migrant flows to historic lows. The flow of immigration attempts over the last year has collapsed by 93%.
Objective: Lower Inflation
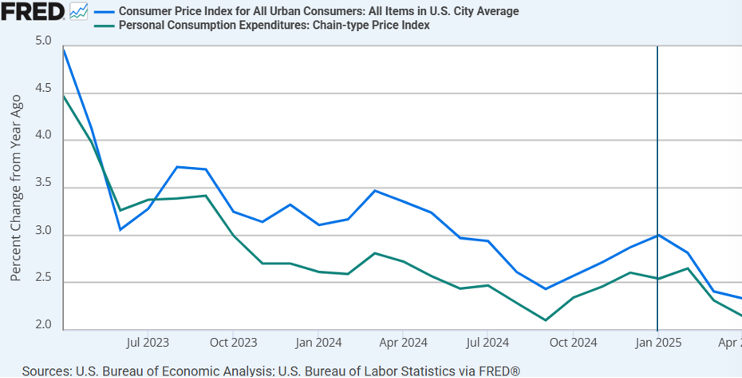
Result:
To no one’s surprise, inflation became the deciding issue in the 2024 election. Trump promised to slash inflation while Biden’s record grafted him to it. As an offset, analysts warned that Trump’s trade and immigration agenda would drive inflation higher, not lower. While the impacts of the tariff rates (also uncertain) haven’t fully registered, on Friday we received another pleasantly surprising inflation report. CPI and PCE inflation rates started the year at 2.99% and 2.54%, respectively. They have since fallen to 2.3% and 2.1% through April.
Objective: Lower Interest Rates
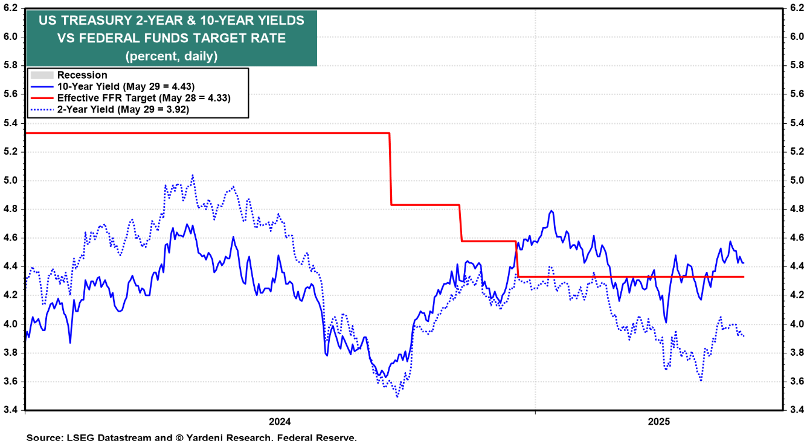
Result:
Interest rates have acted as the disciplinarian in the Trump trade war. The spike higher in the 10-year Treasury Yield following liberation day led to the leadership ascent of Treasury Secretary Bessent and a 90-day pause on all reciprocal tariffs. Since then, recession odds have fallen, and longer-term Treasury yields have vacillated within a reasonable range. Budget anxieties and the Moody’s downgrade have led to periodic spikes, but auctions overall remain healthy. To date, Trump’s pressure on Powell hasn’t resulted in lower overnight rates. The Federal Funds rate began the year at 4.5% and remains at 4.5% today. Further out on the curve, 2-year Treasury rates have fallen .30% this year, while 10-year Treasury rates have fallen .16%.
Objective: Lower Taxes
Last week the House of Representatives passed Trump’s Big Beautiful Bill on to the Senate. With a thin Senate majority and dispute resolution from both houses required for passage, tax cuts remain unassured. However, the betting markets seem pretty confident Trump will achieve this objective:
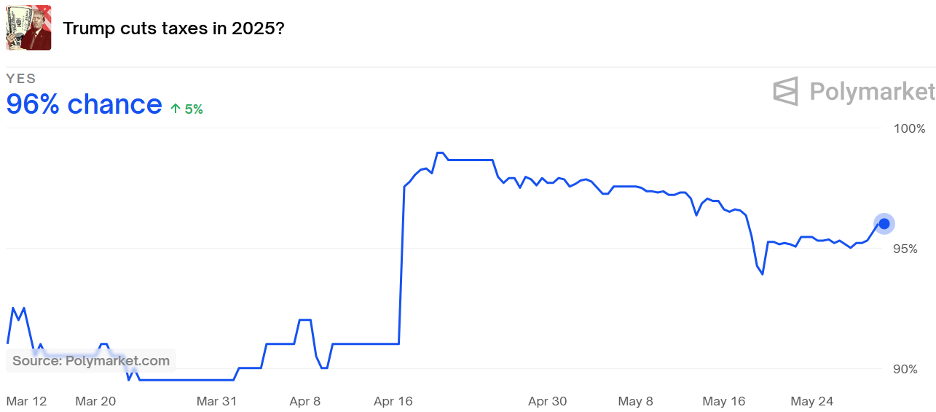
Result:
TBD.
Objective: Less Government
![]()
Result:
Elon Musk returned to the private sector this week with DOGE falling well short of his objectives. However, the Trump administration’s efforts to “drain the swamp” will undoubtedly continue. Unfortunately, continued DOGE cost savings efforts within the discretionary budget will themselves get swamped by higher interest expenses, unchecked entitlement expansions, and increased defense spending.
In the first quarter of 2025, the US Government spent $140 billion more than it did in the first three months of 2024. Trump’s fiscal year will not officially begin until October 1st, 2025, so it’s a little early to judge his results, but so far, government expenditures have been growing, not shrinking.
Conversely, we have seen deregulatory efforts bear fruit. Through executive orders, Trump has slashed 31 EPA regulations and rescinded 78 Biden-era orders and regulations targeting DEI, climate change, immigration, and COVID-19. He also instituted a 10-1 mandate requiring the elimination of 10 regulations for every new regulation and a directive that the total cost of new regulations must be “significantly less than zero” ensuring a net reduction in regulatory costs.
Objective: Higher Tariff Revenue
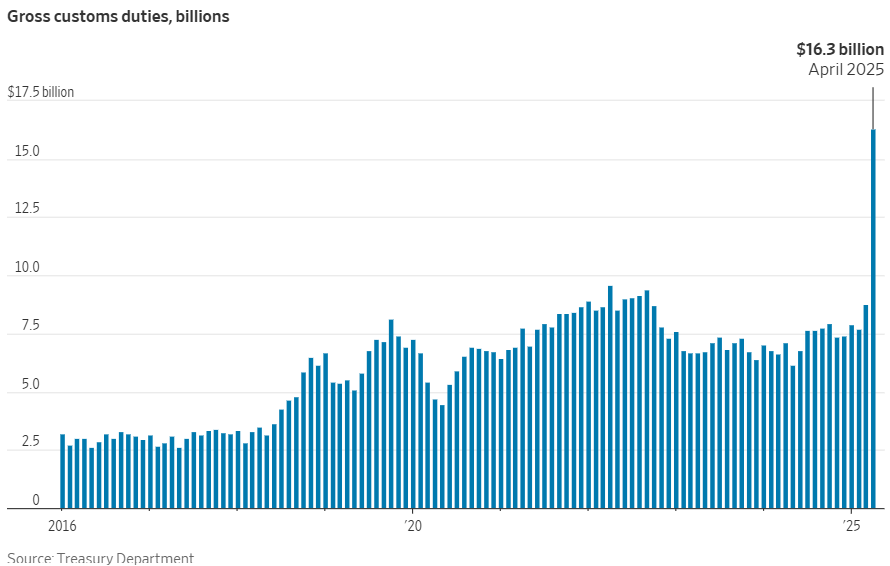
Result:
The Federal Government collected $16.3 billion in tariff revenue in April. This number far exceeds the $7 billion collected last April and annualizes out to nearly $200 billion in collections. With the tariff rates and retaliation measures uncertain, these annualization figures could move far higher or far lower, but for the moment, US collections at its borders have surged.
Objective: Lower US Dollar
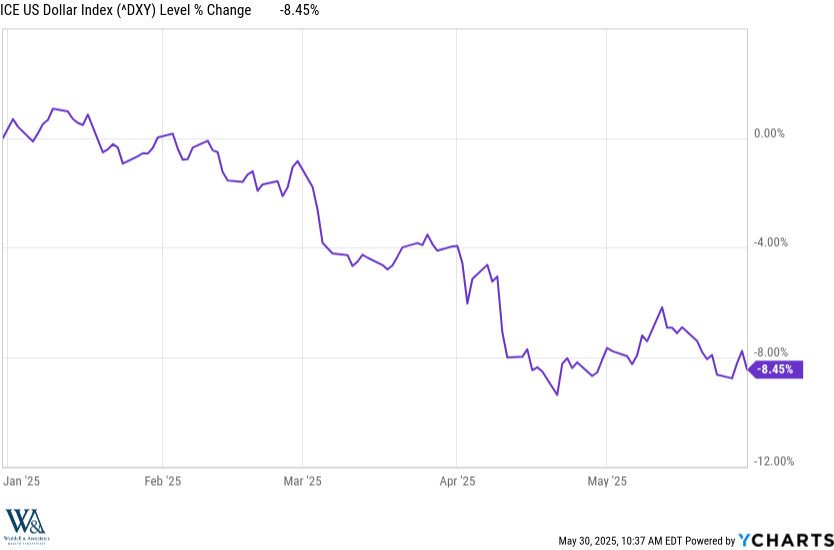
Result:
While US Presidents and Treasury Secretaries historically default to promoting US Dollar strength, Trump and Bessent have noted that much of our trade deficit issues can be explained by over-valuation of the US dollar. Trump’s trade negotiations—including currency concessions and pressure on Powell to lower rates—align with his weak dollar objective. Of our largest trading partners, the Euro has appreciated nearly 10% against the US dollar so far this year, the yen Yen more than 9%, and the Yuan just over 1.5%. Textbook economics suggests that higher tariffs that reduce import volumes and increase export volumes should strengthen currency, but Trump’s negotiation style has produced just the opposite. Whether this has been an accident or not I leave for cocktail chatter. Per the data, the US dollar has weakened as intended.
Objective: Faster Economic Growth
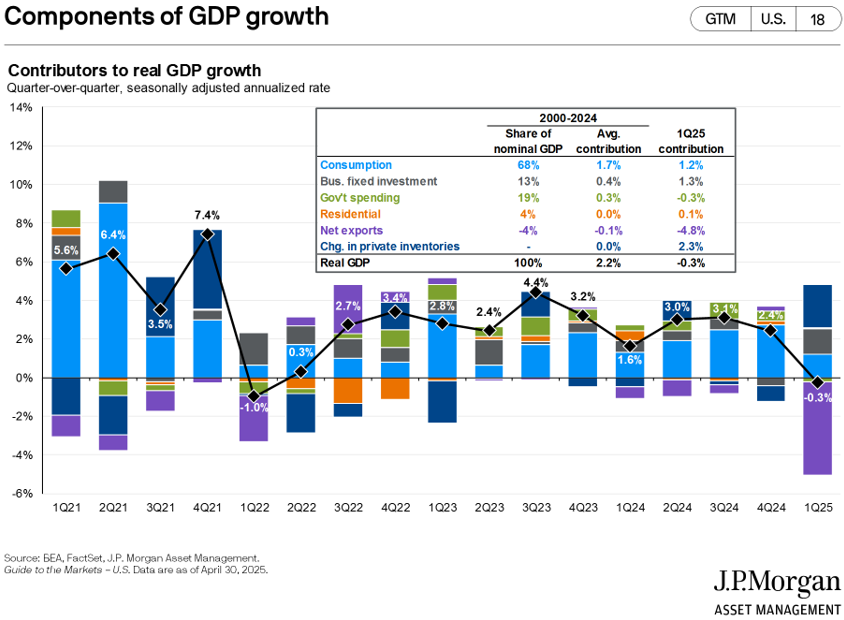
Result:
Nope. First quarter GDP shrank .2% as the BEA reported in this week’s revision. That marks a significant slowing from 4th quarter’s GDP growth rate of 2.4% and 2.5% for last year overall. However, stripping away the historic import levels in anticipation of “Liberation Day” would have resulted in decidedly positive GDP growth for the quarter. Stripping out imports and inventory builds, the combination of consumer, government, and housing activity would have produced a GDP growth rate of 2.3%. Deducting average net export contributions would have resulted in a 2.2% growth rate—still lower than Q4 and last year’s average, but above the 1.9% seen as our long-run potential by the Federal Reserve. Nonetheless, the numbers are the numbers, and in the first quarter, US GDP shrank.
Objective: New Stock Market Highs
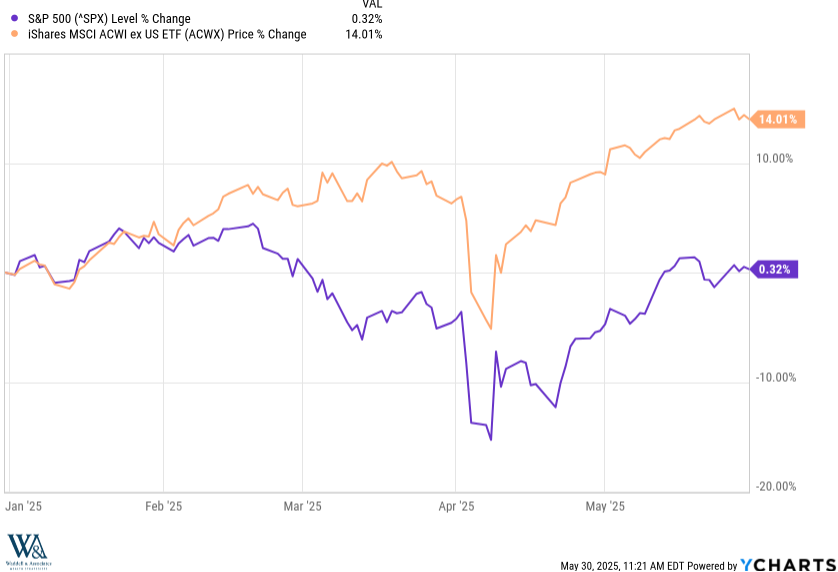
Result:
The S&P 500 hit an all-time high on February 19th, 2025—technically achieving Trump’s campaign objective. However, since then, the market has experienced both a historic decline and a historic recovery. While slightly positive on the year, the S&P 500 stands 4% below record highs.
Comically, while the US markets remain below their all-time highs, this week, the international markets—as measured by the MSCI All Country World ex-USA (ACWX)—hit new all-time highs. So far, Trump’s 2nd term has made ex-USA stock markets the greatest they have ever been. In sum, the market has begun to build up a tolerance for Trumps tactics as it gets more comfortable with the results.
Related: Steady Hands in Shaky Financial Markets
Sources: Federal Reserve Bank of St. Louis, Yardeni Research, YCharts, Polymarket, doge-tracker.com, US Treasury, JP Morgan Asset Management