

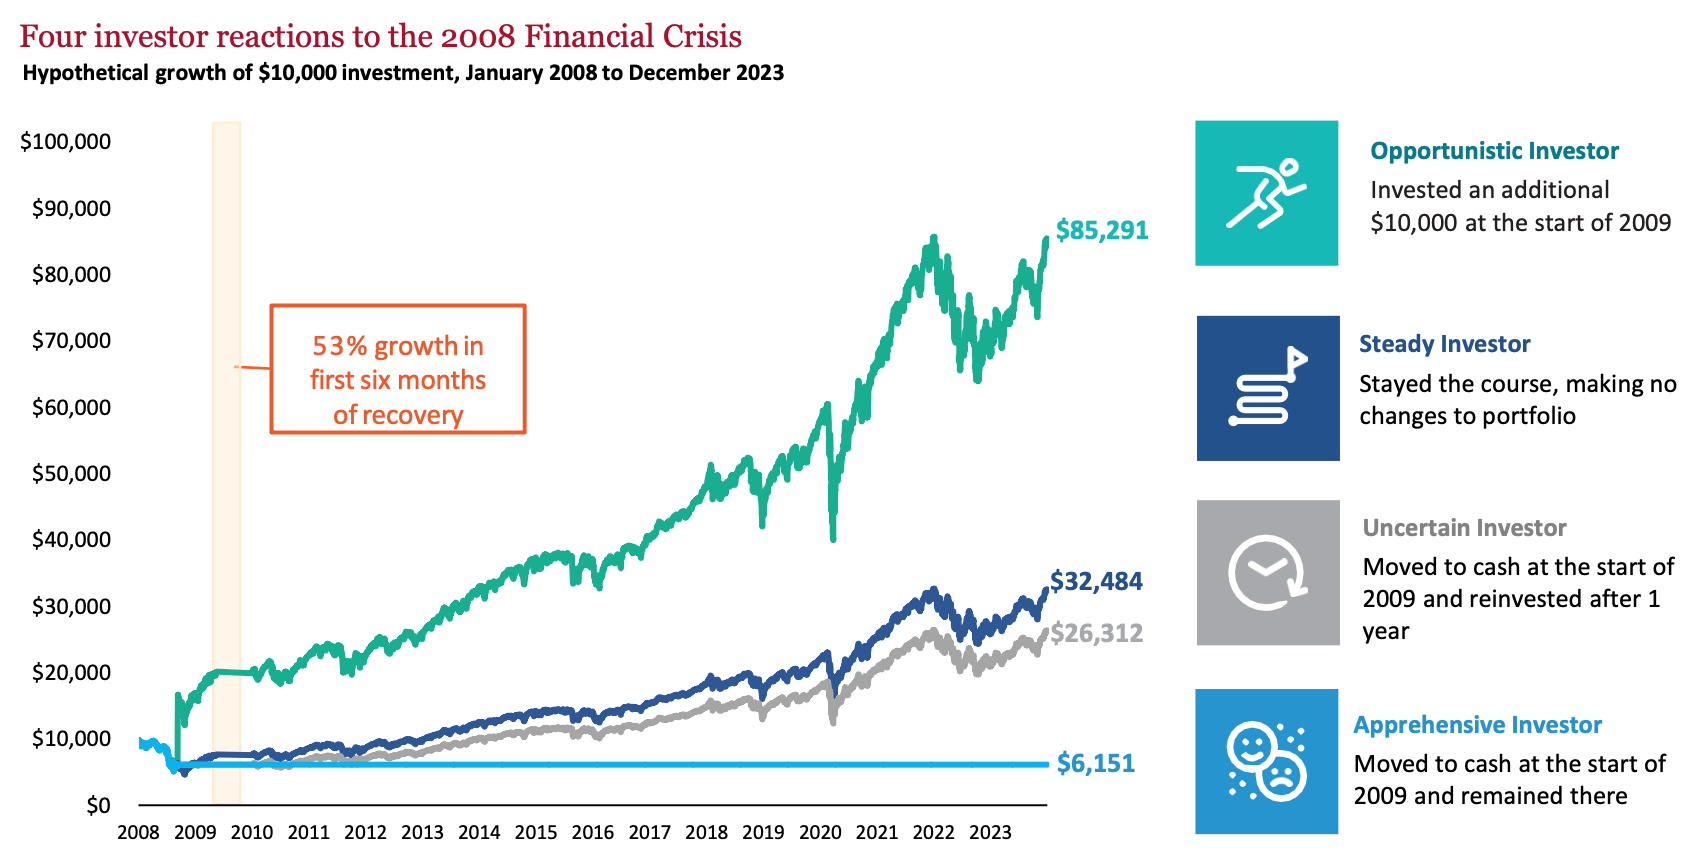
What is this chart showing?
This chart shows how four different investors may have responded to the market volatility during the 2008 Financial Crisis.
Why is it important?
Investors can use this to help understand how different reactions to market volatility can impact their long-term outcomes.
While the steady investor outperformed those who moved to cash, the opportunistic investor who invested an additional $10,000 during this period of market volatility had the most positive outcome of the group.
Related: Sequence of Returns: A Tale of Two Investors
Source: Morningstar, Lincoln Financial Group. 1/1/2008 – 12/31/2023. S&P 500 Price Return Index used, which does not include dividends. Cash assumed to have a net yield of 0%. Past performance is not indicative of future returns. You cannot invest directly in an index. All indices are unmanaged and do not include fees or expenses. Please see the back of this presentation for index definitions and disclosures.
LCN-6306131-013024