

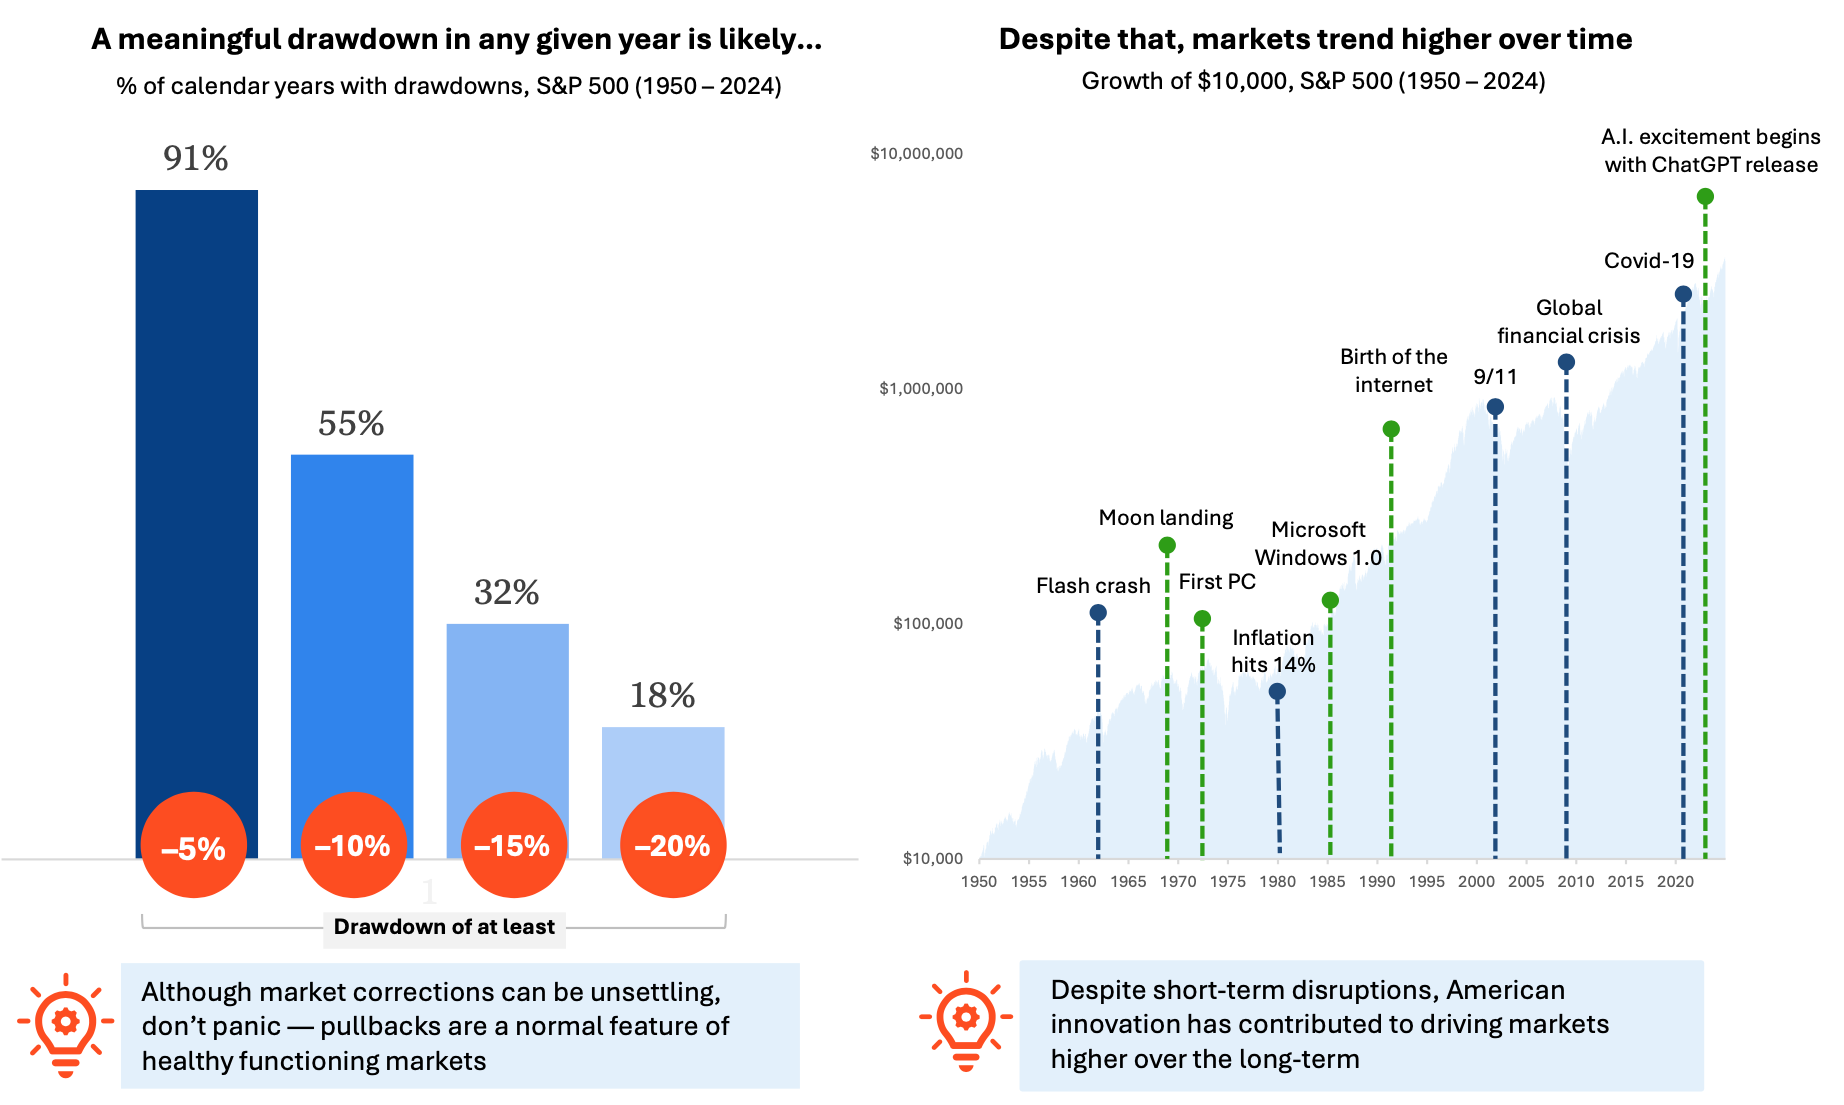
What is this chart showing?
This chart shows the percentage of calendar years since 1950 that saw a drawdown of at least 5%, 10%, 15%, and 20% (left) and the long-term growth of $10,000 invested in the S&P 500 with a handful of significant events overlayed (right).
Why is it important?
Despite a mostly calm year in 2024, drawdowns are a normal occurrence — even during healthy bull markets.
Nearly all calendar years see stocks decline at least 5%, and more than half see double-digit drawdowns. Additionally, the average year experienced a decline of nearly 14%. Despite this, stocks still finished with gains in 73% of all years.
While these drawdowns can be unsettling, the best course of action is often to stay the course. Because over the long term, markets tend to march higher, with most of these declines ending up looking like nothing more than a small bump in the road.
Source: Morningstar. S&P 500 Price Return Index. Average max intra-year decline was 13.7%. Past performance does not guarantee or predict future performance. Index performance is for illustrative purposes only. You cannot invest directly in the index.
Download the latest edition of Lincon's flagship chartbook, updated monthly with data and insights on the economy, markets and investment trends, and sign up for future updates.
Related: Two Years of 20% Gains—Is There Really a Reason to Be Bearish?