

Trending

What the start of rate cuts could mean for markets
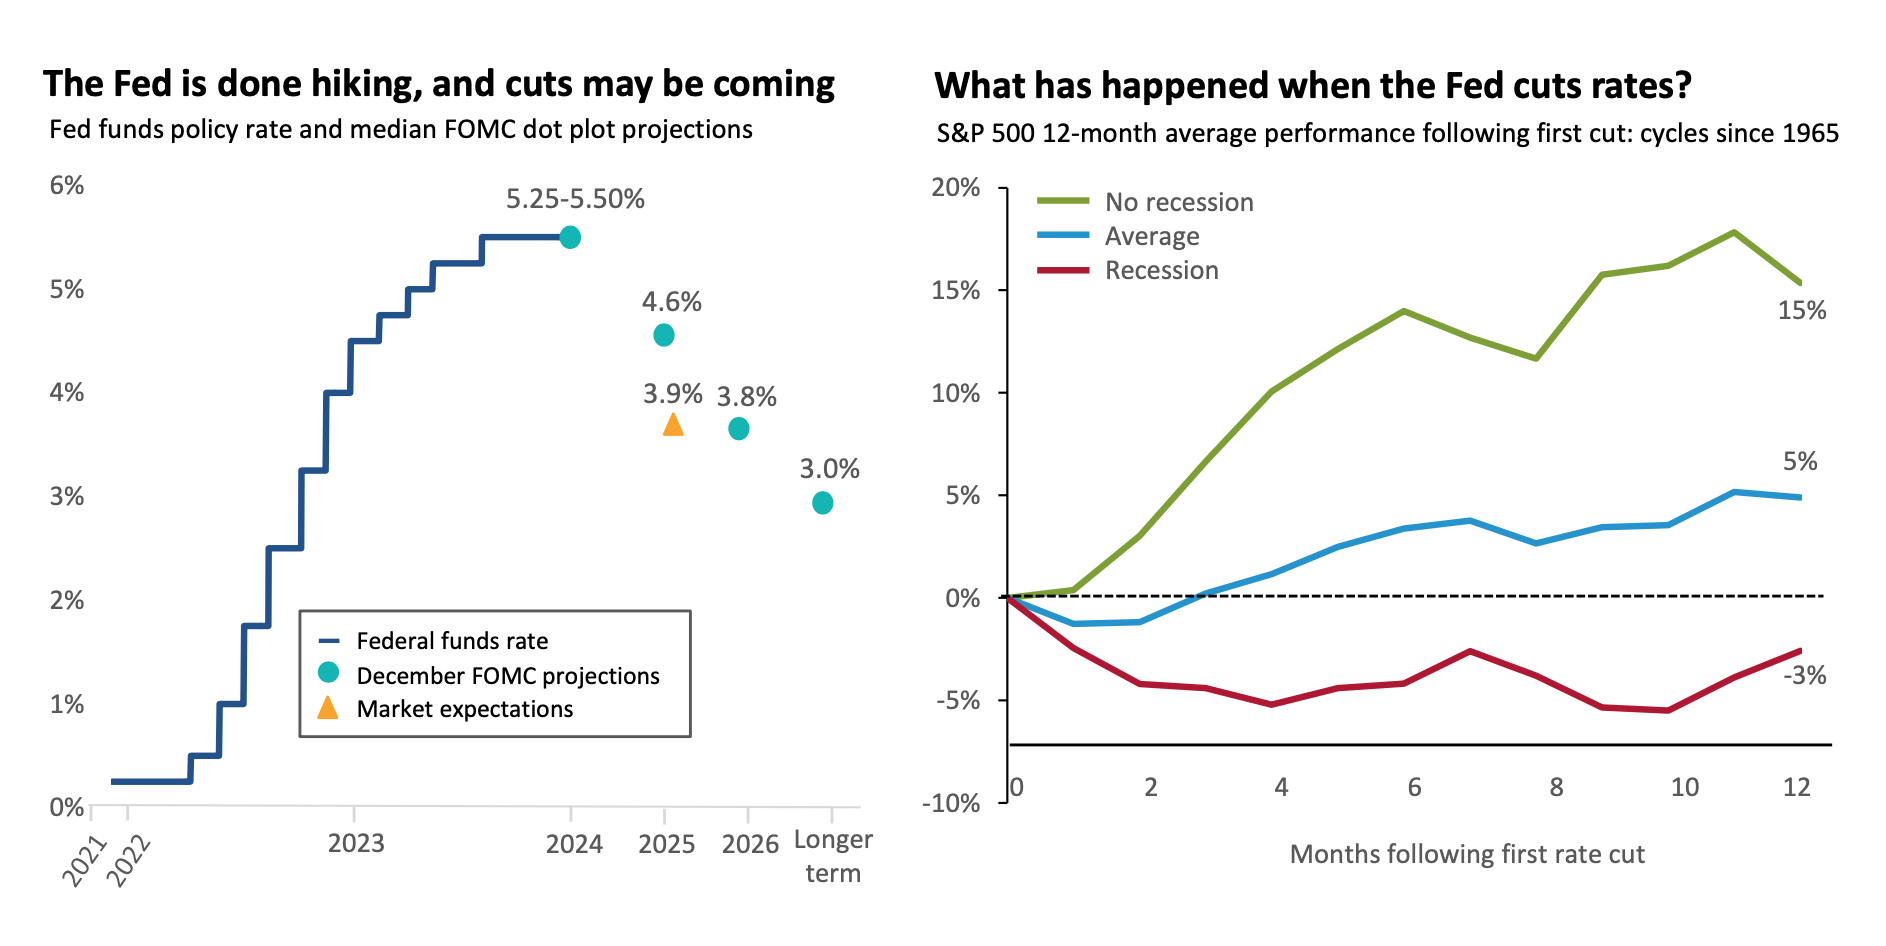
What is this chart showing?
The chart on the left shows the current Fed funds rate, as well as future projections from both the Federal Open Market Committee (FOMC) and market participants.
The chart on the right shows S&P 500 returns for the twelve months following the first rate cut in previous cycles.
Why is it important?
Thanks in large part to declining inflation, a pivot in FOMC policy is on the horizon.
What this could mean for equity markets is likely to come down to the state of the U.S. economy.
History shows that on average, returns in the twelve months following the first rate cut are positive, but roughly half the long-term average of stocks.
However, there is a stark difference in results during times where the economy avoided a recession throughout these twelve months, versus those when a recession occurred.
Source: (Left): Federal Reserve, Federal Reserve Bank of St. Louis, Bloomberg as of January 31, 2024. Projected rates listed for 2025 and 2026 represent values as of year-end of the previous year. I.e. 2025= 12/31/2024. (Right): Federal Reserve, NBER, Bloomberg Finance L.P. Analysis provided by J.P. Morgan as of December 11, 2023. Analysis incorporates cutting cycles that began in: Nov '66, Aug '69, June '74, May '81, Oct '84, Jun '89, Jul '95, Sep '98, Jan '01, Sep '07, Jul '19, and Mar '20. Recession is determined by an NBER-defined contraction that occurred within 12 months of the first cut, excluding the 2019 cycle preceding the COVID-19 pandemic.