
Trending

Written by: Meera Pandit
Macro environments change, but investors consistently seek the same outcomes in portfolios: alpha, income and diversification. With equity markets up double-digits producing solid returns and yields at their highest levels in over a decade providing attractive income, diversification has been the most elusive outcome this year.
One of the most reliable sources of diversification – bonds – has continued to struggle, with the Bloomberg U.S. Aggregate index on track for its third consecutive annual decline. Not only have returns struggled, but the ride has been unusually volatile for investors. The MOVE index, which measures interest rate volatility, is currently at 119, which is consistent with its average reading since the onset of rate hikes in 2022, and on par with peak rate volatility during the onset of the pandemic. This compares to an average reading of 85 since 2008. With the entry point still compelling on bonds and the prospects for yields to decline over the next 12 months, investors may not want to give up on bonds, but rather expand their sources of diversification.
Some investors have turned to other traditional hedges, like gold and the U.S. dollar. However, gold is 28% more expensive than its long-term average since 2008, and has only reached present levels during periods of heightened stress – during the pandemic, when the Fed began hiking rates in 2022 and in the aftermath of the regional banking crisis this spring. Although central bank demand has likely contributed to elevated gold prices, individuals looking for a hedge in gold are not only finding it at a historically high cost but also at a significant opportunity cost as it offers no income against a backdrop of higher yields. Similarly, although the U.S. dollar has retreated from its highs last fall, it has been on a broader ascent since 2011 and continues to look expensive.
While many of the traditional sources of diversification have been challenged by market conditions, alternative investments can enhance diversification. In particular, real assets like real estate and infrastructure have exhibited low or no correlation to both global stocks and bonds, as illustrated below, and have low or negative correlation to a traditional 60/40 portfolio. Over the last decade, infrastructure experienced 3.4% annualized volatility and U.S. core real estate experienced 4.3%, compared to U.S. fixed income at 4.4% and a globally diversified portfolio at 10.6%. In addition, infrastructure has been able to deliver stable income through varying interest rate environments, which has been a challenge for fixed income. Real assets’ ability to deliver low correlation to public markets, low volatility and stable income warrants consideration from investors looking for other sources of diversification.
Public and private market correlations
Quarterly returns, 2008-1Q23
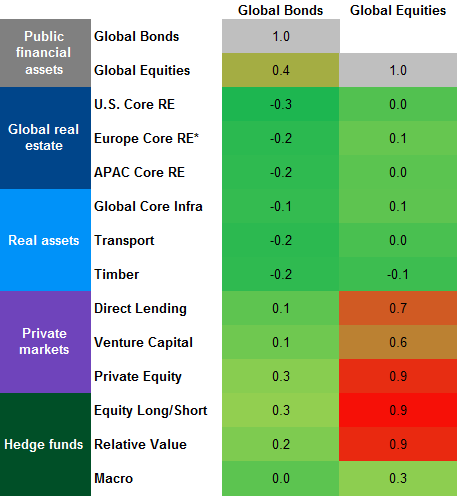
Source: MSCI, Bloomberg, Burgiss, NCREIF, Cliffwater, HFRI, J.P. Morgan Asset Management. *Europe Core RE includes continental Europe. Private Equity and Venture Capital are time weighted returns from Burgiss. RE – real estate. Global equities: MSCI AC World Index. Global Bonds: Bloomberg Global Aggregate Index. U.S. Core Real Estate: NCREIF Property Index – Open End Diversified Core Equity component. Europe Core Real Estate: MSCI Global Property Fund Index – Continental Europe. Asia Pacific (APAC) Core Real Estate: MSCI Global Property Fund Index – Asia-Pacific. Global infrastructure (Infra.): MSCI Global Quarterly Infrastructure Asset Index. U.S. Direct Lending: Cliffwater Direct Lending Index. Timber: NCREIF Timberland Property Index (U.S.). Hedge fund indices include equity long/short, relative value, and global macro and are all from HFRI. Transport: returns are derived from a J.P. Morgan Asset Management index. All correlation coefficients are calculated based on quarterly total return data for the period 6/30/2008 – 3/31/2023, except correlations with Bitcoin which are calculated over the period 12/31/2010 – 3/31/2023. Returns are denominated in USD. Guide to Alternatives: Data are based on availability as of August 31, 2023.
Related: How to Position Fixed Income Under Different Economic and Interest Rate Scenarios?