
Trending

The average Wall Street forecast for job growth was 200k, with the highest individual at 290k. Per Friday’s BLS employment report, the number of new jobs is 303k, beating every estimate. The latest job numbers continue to outperform analysts’ expectations seemingly every month. The three-month moving average has also been rising steadily. Currently, it stands at 276k. Also, the unemployment rate ticked down by .1% as the participation rate rose.
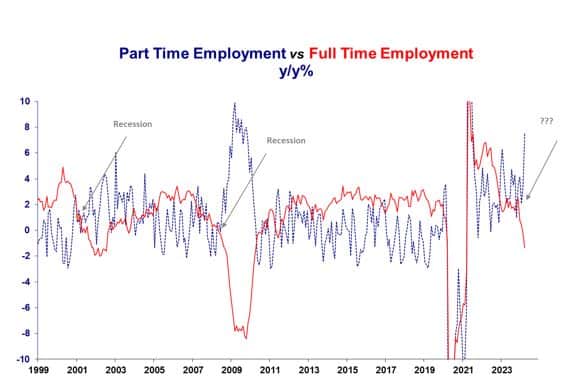
While analysts underestimated job growth, they correctly forecasted the average hourly earnings. Year-over-year wage gains are at 4.1%, the lowest level in almost three years. A strong job market typically results in rising wages as employees have more leverage over their employers. Our theory as to why wages are not rising more rapidly is that the quality of jobs is decreasing. For example, we shared data in Friday’s Commentary showing that a third of the job growth is coming from the leisure and hospitality industry, which is the lowest-income industry. In Friday’s BLS report, the second lowest paying sector, healthcare, and government accounted for 50% of the jobs. The highest-paid sector, information technology, saw zero job growth. Additionally, higher-paying full-time employment is down 1.3% over the last year, while lower-paying part-time employment is up 7.5%.
Given their mandate to maximize employment and maintain stable prices, the Fed should like this data.
Market Trading Update
Last week, we discussed the current bullish trend’s ongoing, mind-numbing, narrow channel. We have suggested there was little to worry about until the 20-DMA was violated. That “crack” to this “unstoppable” bullish rally happened Thursday.
However, as we previously noted, just because the market breaks the 20-DMA does not mean that action must be taken immediately. What we need to see is a confirmation of that break with either a failed retest of previous support or a further decline. On Friday, the stronger-than-expected employment report sent stocks higher as “good news is good news” as stronger economic growth should support earnings. However, “bad news also remains good news,” as it would mean Fed rate cuts.
In other words, we continue to be in a “heads I win, tails I win” market.
On Friday, that market rally failed to retake the previous support trend of the 20-DMA. If the market is lower on Monday and takes out Thursday’s low as shown, this would confirm the break of support and suggest lower prices. The 50-DMA will quickly become the next major support level.
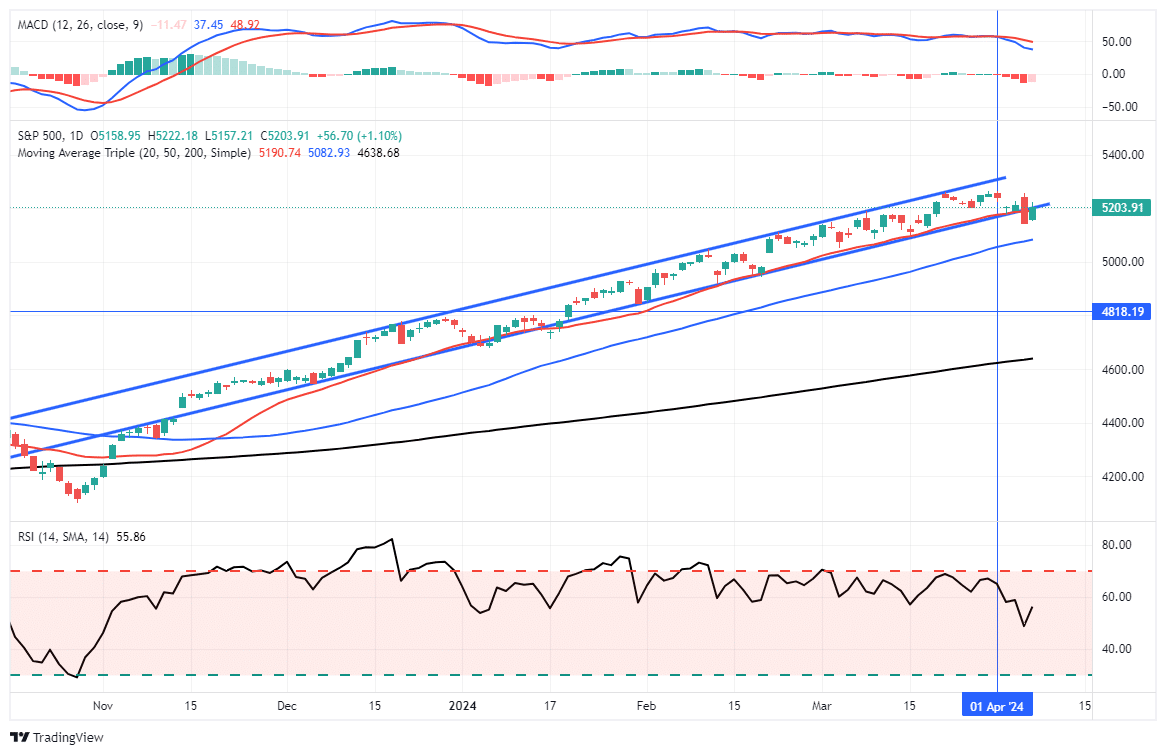
While the market may remain range-bound between recent highs and the 50-DMA over the next month or so, we expect a deeper correction (~10%) before the election. Such a correction would likely test the 200-DMA and reverse much of the recent bullish market exuberance, as shown by both retail and professional investors.
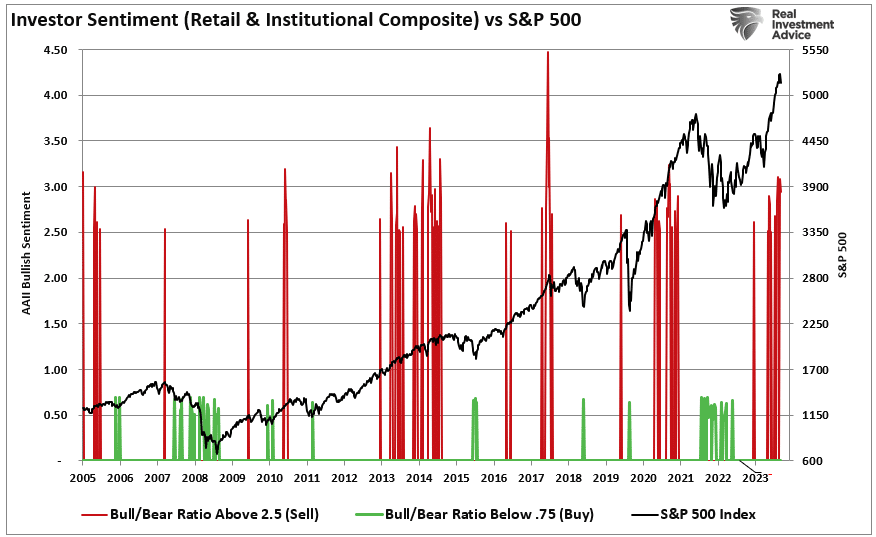
A reversal of sentiment and price deviations would provide a better entry point for increasing portfolio equity exposures. Of course, the market has been so complacent for so long that even a completely normal 5-10% correction will “feel” far worse than it actually is.
With the market overbought and extended currently, we want to remain cautious about aggressively committing our cash reverses to the broad market. However, such can be very hard to do in a rising bull market that seems unstoppable.
“Willingness and ability to hold funds uninvested while awaiting real opportunities is a key to success in the battle for investment survival.” – Gerald Loeb
The Week Ahead
With the latest round of jobs data behind us, the market will focus on inflation and corporate earnings.
Expectations for Wednesday’s core and monthly headline CPI figures are +0.3% and +0.1% below the prior month’s readings. On Thursday, the PPI report is expected to rise 0.3% and 0.2% on a headline and core basis. The estimates are 0.3% and 0.1% lower than last month. Also, the FOMC will release the minutes from the prior meeting on Wednesday. Given that one Fed speaker after another has offered caution about cutting rates too soon but at the same time offering the Fed will likely cut rates 2-3 times this year, we suspect the minutes will affirm a similar outlook. Anything other than that is likely to affect the stock and bond markets. In addition to the Fed and inflation data, the bond market will also be focused on Wednesday’s 10-year Treasury auction and Thursday’s 30-year auction.
With the exception of the large banks, smaller, lesser-known companies will report earnings predominantly this week. JPM, Wells Fargo, Citigroup, and Blackrock report their Q1 earnings on Friday. Loan write-offs and adjustments to loan loss reserves will be of particular interest as they provide information about the consumer’s health. Further, net interest margins inform us of how much incentive banks have to lend.
More On Market Rotations
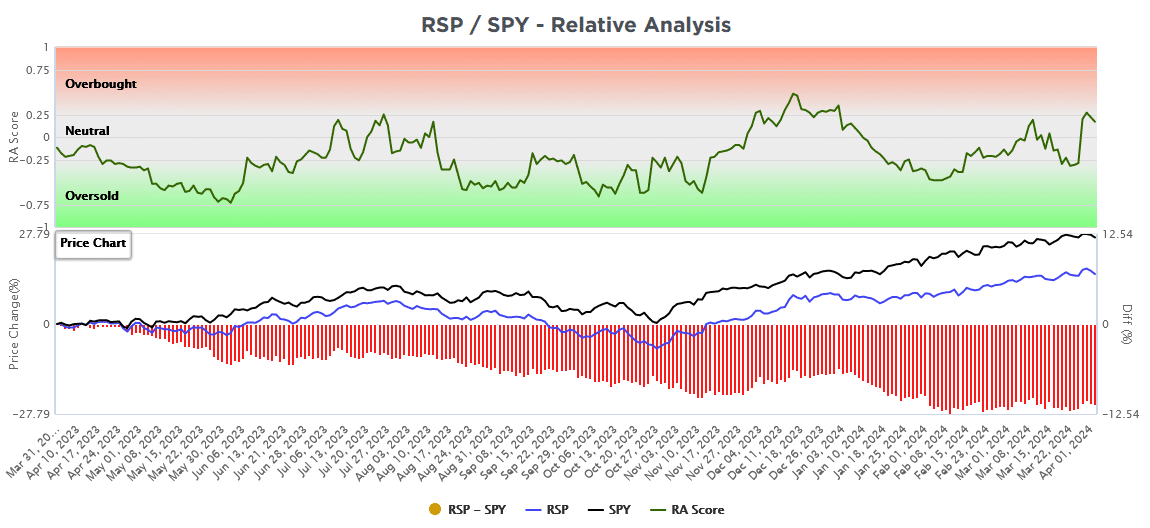
Thursday’s Commentary led with a report from Sentimentrader, which points to a potential market rotation favoring the equal-weighted S&P 500 (RSP) versus the well-followed market-cap-weighted S&P 500 (SPY). We thought it might be helpful to provide further guidance based on what our SimpleVisor proprietary sector and factor performance technical models show. The top graph below shows our relative technical score based on the RSP/SPY price ratio. The score has been below zero most of the last year, signaling strength in the SPY versus the RSP. From early December to mid-January, the score rose into moderate overbought territory as RSP gained on SPY. That was short-lived, as we can see in the lower graph.
The lower graph tracks the prices of RSP and SPY and the performance difference between them. It shows that both indices have been up decently over the past year. However, the price ratio of RSP to SPY is down by about 12%. Therefore, owning RSP instead of SPY produced positive returns but were well below what an investor in SPY earned.
The score is currently in neutral territory and has been steadily rising since early February. Over the same period, the return differential has improved by about 1.5% in favor of RSP. While the negative trend in the price ratio may have been arrested, the SimpleVisor relative analysis score is not yet signaling that a rotation to RSP has legs to run. We will closely monitor this analysis to help us better track the potential for a significant market rotation.
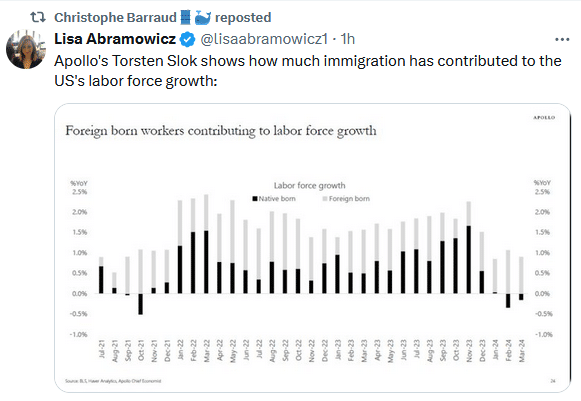
Tweet of the Day
“Want to have better long-term success in managing your portfolio? Here are our 15-trading rules for managing market risks.”
Related: Service Sector Weakens While Manufacturing Strengthens