When there is a discussion of low future returns due to valuations, what gets missed is that such requires a bear market.
Let me explain.
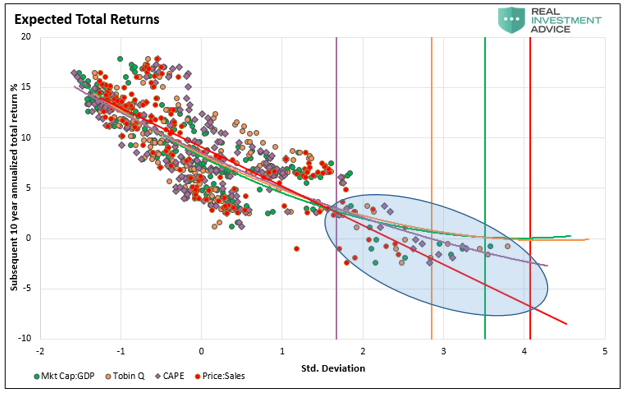
In “Do You Feel Lucky,” Michael Lebowitz compiled a series of valuation metrics and their correlation to future returns. To wit:
“The average of the 10-year expected returns from the four gauges is -0.75%. When the Fed backs off, whether by its design or due to inflation, slower economic growth, or massive debt overhead, rich valuations will matter.”
The mistake many investors make is assuming that such means every year, over the next decade, returns will be near zero. As we will discuss, it is not every year, but one or two awful years, impacting the whole.
Fun With Math
The vital point to understand is that over the long-term investing period, “value” and “returns” are both inextricably linked and opposed. As shown above, forward return expectations are lower than the long-term average given current valuation levels.
Let’s review what “low forward returns” does and does not mean before looking at different valuation measures.
- It does NOT mean the stock market will have annual rates of return of sub-3% each year over the next 10-years.
- It DOES mean the stock market will have stellar gains in some years, a big crash somewhere in between, or several smaller ones, and the average return over the decade will be low.
“This is shown in the table and chart below which compares a 7% annual return (as often promised) to a series of positive returns with a loss, or two, along the way. (Note: the annual average return without the crashes is 7% annually also.)”
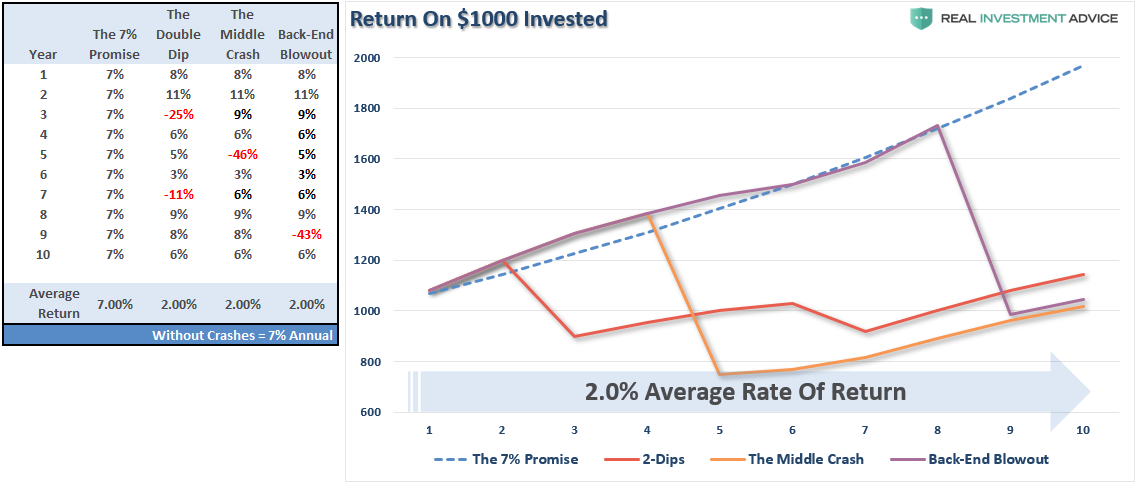
“From current valuation levels, two-percent forward rates of return are a real possibility. As shown, all it takes is a correction, or crash, along the way to make it a reality.”
Such isn’t a prediction; it is just statistical probability and simple math.
Most importantly, as stated above, none of these factors or measures mean the markets will produce single-digit rates of return each year for the next decade. The reality is there will be some strong return years during that period. Unfortunately, the bulk of those years will get spent making up previous losses.
That is the nature of investing in the markets. It is just part of the full-market cycle.
Why A 50% Correction Is Required
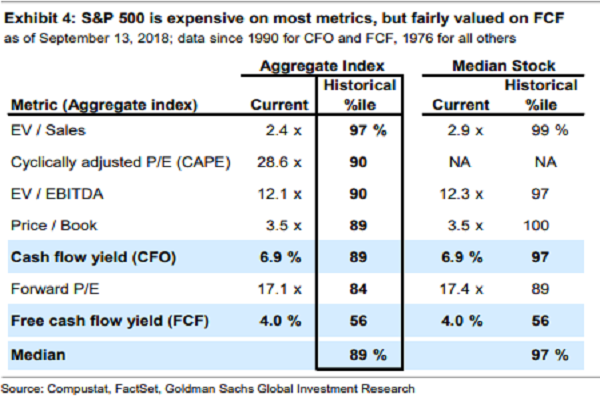
One of the essential issues overhanging the market is simply that of valuations. As Goldman Sachs pointed out recently, the market is pushing the 89% percentile or higher in 6 out of 7 valuation metrics.
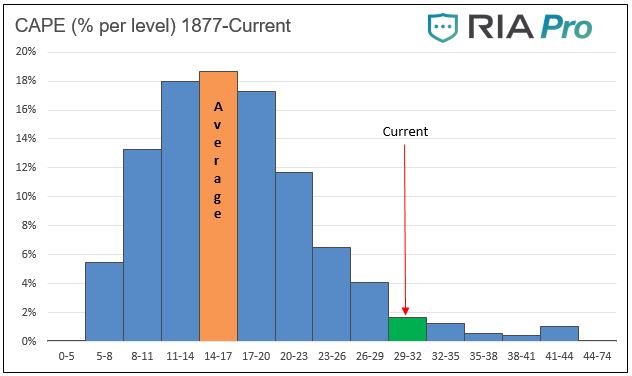
So, just how big of a correction would be required to revert valuations to long-term means? Michael Lebowitz recently did some analysis for RIA PRO:
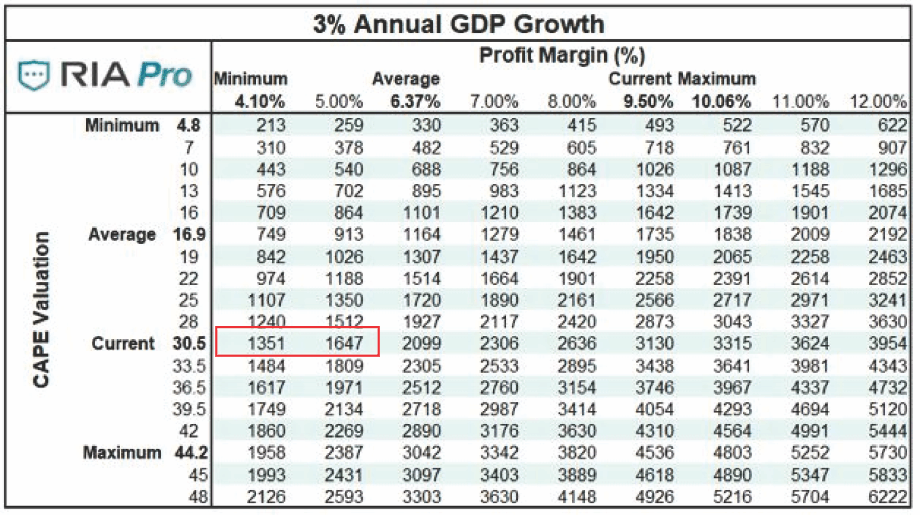
“Since 1877 there are 1654 monthly measurements of Cyclically Adjusted Price -to- Earnings (CAPE 10). Of these 82, only about 5%, have been the same or greater than current CAPE levels (30.5). Other than a few instances over the last two years and two others which occurred in 1929, the rest occurred during the late 1990’s tech boom. The graph below charts the percentage of time the market has traded at various ranges of CAPE levels.”
Given that valuations are at 30.5x earnings and that profit growth tracks closely with economic growth, a reversion in valuations would entail a decline in asset prices from current levels to somewhere between 1350 and 1650 on the S&P (See table below). From the recent market highs, such would entail a 54% to 44% decline, respectively. (To learn how to use the table below to create your own S&P 500 forecast, give RIA Pro a 14-day free trial run.)
Such also corresponds with the currently elevated “Price to Revenue” levels, which are now higher than at any point in previous market history. Given the longer-term norm is 1.0, a reversion as seen in 2000 and 2008, each required a price decline of 50% or more.
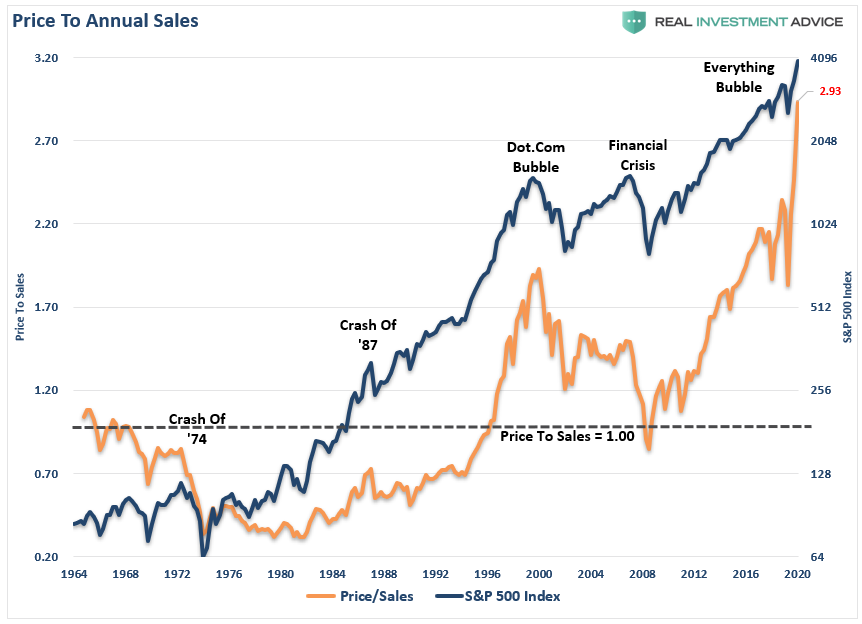
As expected, 10-year forward returns are below zero historically when the price-to-sales ratio is at 2x. There has never been a previous period with the ratio climbing to near 3x.

What Would A Mean Reversion Entail?
The chart below uses Fibonacci retracement measurements as potential reversion levels. It is worth pointing out markets are currently pushing 2-standard deviations above the 50-week moving average. As noted, markets trend above the 50-week moving average during bull markets. Bear markets trend below that average.
Importantly, corrections during bull markets can temporarily break below that average but quickly rise back above it. Such is why March of 2020 was a “correction” and not a “bear market,” as price trends did not change.
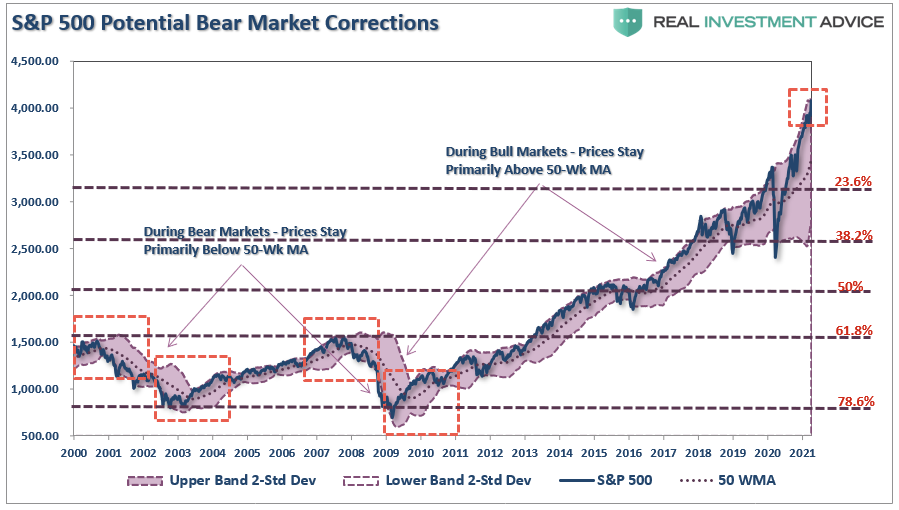
Using those Fibonacci retracement levels:
- A 23.6% correction would pull markets back to roughly 3100, leaving the current bull market intact.
- The 38.2% retracement level would start retesting the March 2020 lows. Such will begin pushing the early boundaries of a “bear market” if prices do not recover quickly.
- A bear market will be well entrenched at the 50% retracement level. Valuation levels will approach more reasonable levels of “fair value,” and sentiment will turn negative.
- At a 61.8% retracement level, it will erase a majority of the last decades bull market. While many will suggest such a retracement is unlikely, history suggests such is indeed possible.
- If the 74.6% retracement level gets reached, there will not be many investors left in the market. However, valuations will have reverted to historically cheap levels, which have been the foundation for long-term secular bull markets to begin.
It’s Not Impossible
Such a level certainly seems unthinkable, but as Shawn Langlois previous penned:
“I recognize the notion of a two-thirds market loss seems preposterous. Then again, so did similar projections before the 2000-2002 and 2007-09 collapses.”
While the current belief is that such declines are no longer a possibility due to Central Bank interventions, we had two 50% declines just since the turn of the century. The cause was different, but the result was the same.
The next major market decline will get fueled by the massive levels of corporate debt, underfunded pensions, and record “margin debt,” and the lack of “market liquidity.”
What Will Cause It?
The real problem with discussing corrections is three-fold:
- It is has been so long since we have had a bear market, many investors have forgotten what happens, and more importantly, how they reacted previously.
- The majority of mainstream media advice gets written by individuals who don’t manage money for a living, have no substantial investment capital at risk, and have never actually been through a bear market.
- Given the extremely long market expansion, many investors have genuinely come to believe “this time is different.”
What will cause the next bear market?
I do not have a clue. Nor does anyone else.
Numerous catalysts could pressure such a downturn in the equity markets:
- An exogenous geopolitical event
- A credit-related event (most likely)
- Failure of a major financial institution
- Recession
- Falling profits and earnings
- An inflationary or deflationary spike
- A loss of confidence by corporations that contracts share buybacks
The Cycle Is Always The Same
Whatever the event is, which is currently unexpected and unanticipated, the decline in asset prices will initiate a “chain reaction.”
- Investors will begin to panic as asset prices drop, curtailing economic activity and further pressuring economic growth.
- The pressure on asset prices and weaker economic growth, which impairs corporate earnings, shifts corporate views from “share repurchases” to “liquidity preservation.” Such removes critical support of asset prices.
- As asset prices decline further and economic growth deteriorates, credit defaults begin triggering a near $5 Trillion corporate bond market problem.
- The bond market decline will pressure asset prices lower, which triggers an aging demographic who fears the loss of pension benefits, sparks the $6 trillion pension problem.
- As the market continues to cascade lower at this point, the Fed is monetizing nearly 100% of all debt issuance and has to resort to even more drastic measures to stem selling and defaults.
- Those actions lead to a further loss of confidence and pressure markets further.
The Federal Reserve can not fix this problem, and the next “bear market” will NOT be like that last.
It will be worse.
Low Future Returns Only Require One
Over the next decade, it is unlikely that a 50-61.8% correction will happen without a credit-related event occurring. The question becomes the limits of the Fed’s ability to continue to “bailout” banks and markets once again.
Maybe they can, but I am not sure I want to ride the markets down trying to find out.
The point here is that it only takes one “mean reverting” event over the next decade to lower your annualized returns close to zero. Such does not bode well for retirement plans banking on 6-8% annualized returns or more.
As noted, over the next decade, there will be some terrific “bull market” years to increase portfolio valuations. However, one essential truth is indisputable, irrefutable, and undeniable: “mean reversions” are the only constant in the financial markets over time.
The problem is that the next “mean reverting” event will remove most, if not all, of the gains investors have made over the last five years. Possibly, even more.
Still don’t think it can happen?
“Stock prices have reached what looks like a permanently high plateau. I do not feel there will be soon if ever a 50 or 60 point break from present levels, such as they have predicted. I expect to see the stock market a good deal higher within a few months.” – Dr. Irving Fisher, Economist at Yale University 1929
Related: There Is No Way This Bull Market Doesn’t End Very Badly