
Trending

Stocks continue to struggle.
Two weeks ago, the S&P 500 closed down 2.92%, while the tech-heavy Nasdaq ended down 4.14%.
But something changed in the markets a couple weeks ago…
All year, a few key sectors have consistently defied weak markets and marched higher. Commodity-related stocks like oil, metals, and fertilizer went up while many other stocks went down.
But two weeks ago, the selling pressure was indiscriminate. Even the sectors that were consistently outperforming the market plunged.
As an investor, you may be wondering when this weakness will end…
I can’t tell you the exact date stocks will bottom.
But I can say this: The market will let us know when stocks have bottomed weeks or months before you hear about it on CNBC or other major media.
And there are 3 charts in particular I’m watching for clues of a major reversal. I’ll share them with you today…
But let me first address something...
Many stocks have been in a bear market for over a year…
You wouldn’t know this by looking at the major indices.
The S&P 500 and Dow Jones Industrial Average hit new all-time highs in January, while the Nasdaq hit a record high in November.
Growth stocks are a different story…
You can see what I mean below. This chart shows the performance of the iShares Russell 2000 Growth (IWO), which invests in a basket of growth stocks.
IWO peaked in February 2021… nine months before the Nasdaq peaked.
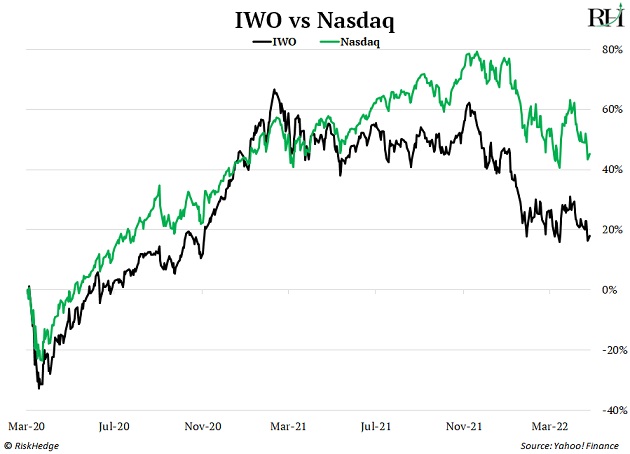
Since then, IWO has fallen 30.81% off its all-time highs. For perspective, the S&P 500 is just 12.94% off its all-time highs.
Growth stocks are approaching their make-or-break moment…
Small-cap growth stocks are riskier than mega cap stocks like Amazon (AMZN) and Apple (AAPL).
That’s because their underlying businesses are more sensitive to economic growth, interest rates, and the business cycle.
Because of this, small-cap growth stocks tend to lead the market. They usually top out well before the major indices do. They also tend to recover before—and more powerfully—than the broad market. So signs of a bottom should appear first in growth stocks.
Let’s look at the charts…
As you can see, IWO is approaching a key support level that predates the COVID-19 crash.
This is a major line in the sand for growth stocks. If IWO bounces off that support level, a bottom could form.
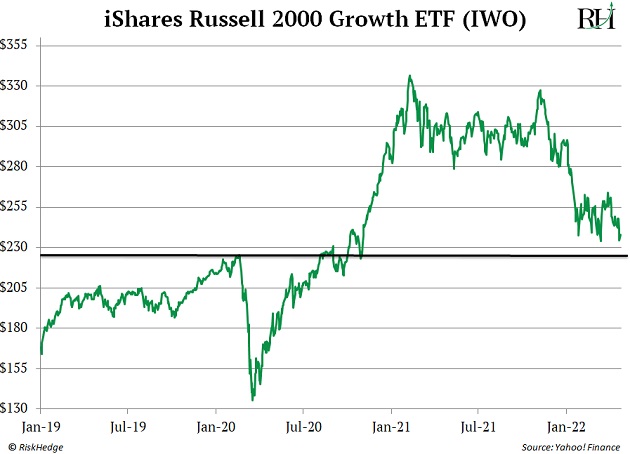
I expect IWO to revisit that key area at around $220/share. That’s about 8% below its Monday close. How prices react when it gets there will tell us a lot about whether the bottom is in.
I’m also closely watching the IPO market…
IPOs are another speculative group of stocks that tend to lead the market…
This next chart shows the performance of the Renaissance IPO ETF (IPO). This fund invests in companies that recently went public.
Many companies go public via the initial public offering (IPO) process. But most of the stocks that make up the IPO ETF are growth stocks.
This makes them a great indicator of overall risk appetite for growth stocks.
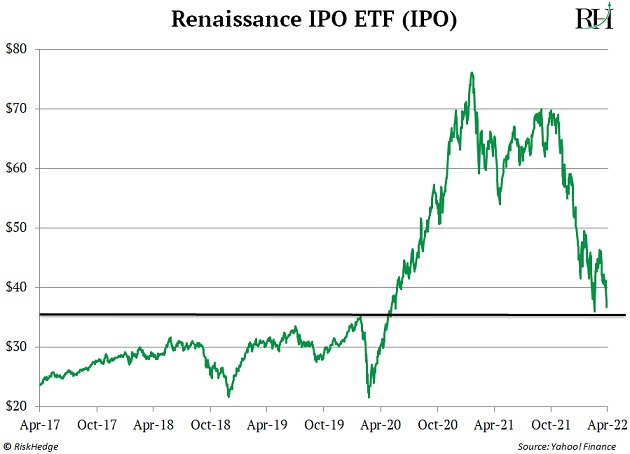
Like IWO, the IPO ETF is approaching a major support level. If buyers step in at this level in a serious way, it could mark a bottom.
But before I give a green light to invest in growth stocks, I want to see one more thing…
I want to see even more fear creep into the market.
You might be thinking investors are already plenty scared. And you’d be right.
CNN’s Fear & Greed Index is composed of seven different indicators that track an aspect of stock market behavior. It’s a number that ranges from 0-100. The lower it is, the more scared people are—and right now it’s at 30 out of 100.
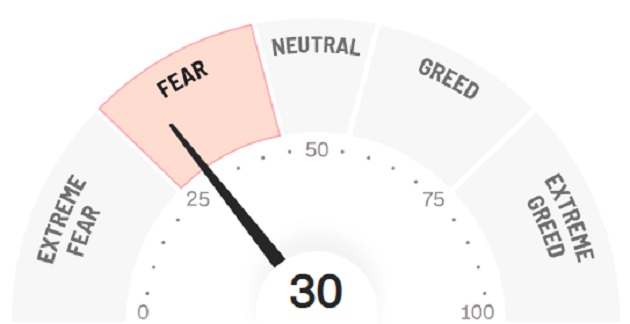
Source: CNN
But true stock market bottoms are usually triggered by panics—or a quick spike in fear. That hasn’t happened yet… but it may soon.
To understand why, let’s look at one more chart. It shows the performance of the Volatility Index (VIX), which measures how volatile traders expect the markets to be in the near term. This is why it’s called the “Fear Index.”
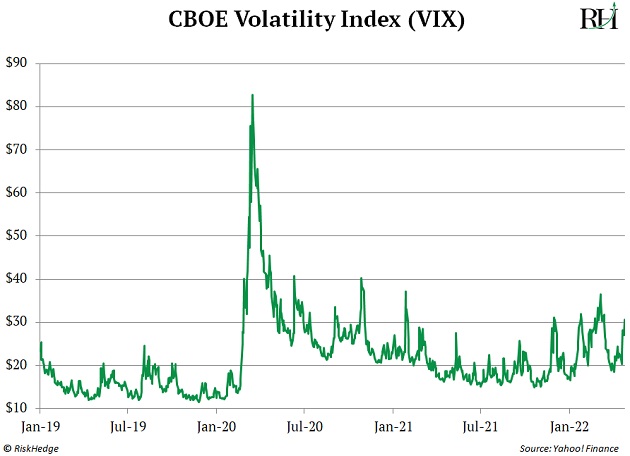
The VIX was up 55% last week and appears to be setting up for a major move higher. If that happens, it could be the clinching piece of evidence that markets have bottomed.
I’ll be closely watching all three of these charts…
If the VIX continues to rise AND growth stocks and IPOs can stabilize at their key support levels, we could have a major buying opportunity on our hands.
3 Breakthrough Stocks Set to Double Your Money in 2022
Get our latest report where we reveal our three favorite stocks that can hand you 100% gains as they disrupt whole industries. Get your free copy here.
Related: My Favorite “Bubble Trade” Today