
Trending

Written by: Erin M. Hay, CFA
Back in January, I wrote about Archer-Daniels Midland ($ADM) after the stock dropped 25% – its largest ever one-day decline – on the heels of suspected corporate fraud.
I ended that post with the following paragraph:
This is anecdotal and less scientific, but very rarely will stocks “trap door” out of nowhere. Usually there are seismographic signs that are often detectable with trend. Again, very anecdotal in nature, but I can’t help but recall Silicon Valley Bank ($SIVB) in March of last year. In an otherwise flat/range-bound market, that stock was down nearly 50% in the 12 months leading up to its surprise March 8 offering, which sent the stock down another 25% after-hours enroute to a very swift conservatorship and bankruptcy.
Let’s make this less anecdotal, if not a bit more scientific
At the very least, I wanted to see if the “stocks don’t trap door out of nowhere” intuition is directionally accurate and not just market lore, and if something like a stock’s 200-day simple moving average might work as a defense mechanism against these types of price moves. In other words: do most stock dives come out of the blue, or are there potential warning signs that we can systematically employ in advance?
As an ocular FYI, here are the charts of both $ADM and $SIVB leading up to their most recent price plummets. They are not pretty. The blue line in the two charts below represents the simple 200-day moving average, which is often thought of as a big/dumb proxy for a stock’s longer-term price trend. I say big/dumb because it’s a well-known indicator, and an indicator that doesn’t have an exact or obvious origin.
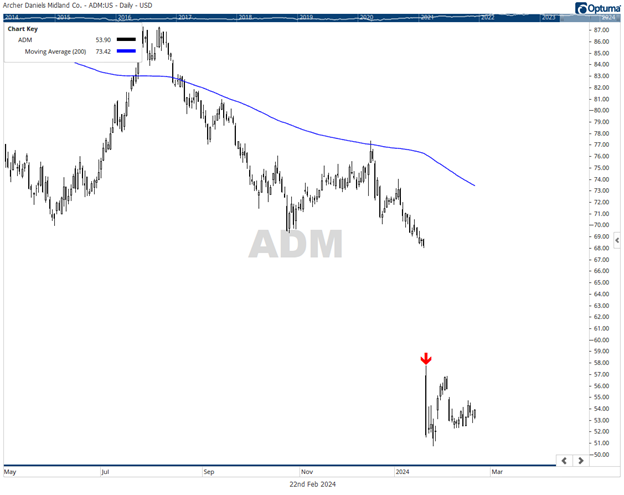
In retrospect, I can’t help but notice a potential “double top” for $ADM during the summer of 2023, as well as some fierce “resistance” at the 200D in both September and December of 2023. Also note the lower highs and lower lows BEFORE the price plunge. Source: Optuma
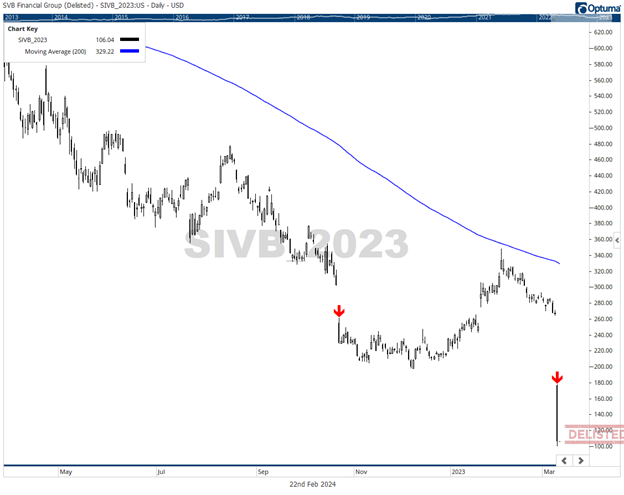
$SIVB had two such instances of 20%+ price declines, while below the 200D, over the past two years, before being delisted. Source: Optuma
I will admit, this line of thinking isn’t necessarily novel. Here are a couple of other notable researchers and investors who feel the same way (any emphasis is my own), and if I’m being honest, these quotes probably planted the seed for this intuition many moons ago!
“One of my early mentors often remarked, ‘Nothing good happens below the 200-day.’ This was his way of recognizing that, while stocks can certainly pop higher from beaten-down levels, you’re more likely to experience sustained advances once the price is above the 200-day moving average. His remarks reminded me of successful chartists like Tom Dorsey relating point and figure charts to football: ‘Can you score a touchdown when the defense is on the field? Sure. But it’s way easier to score a touchdown when your offense has the ball!’” -David Keller, CMT
David Keller was obviously speaking about the opposite use case for the 200-day – i.e., being in stocks above the 200D to increase the likelihood of gains rather than to decrease the likelihood of losses – but the logic still applies. I also included his “Tom Dorsey / point and figure” reference because, as long-time clients are likely aware, we are big proponents of the Dorsey Wright “PnF” methodology, and it heavily informs our Monument Wealth Management Dividend and Growth Models.
Another angle to David Keller’s thoughts that I’ve seen over my years as an advisor: many people balk at owning stocks at or close to their all-time highs, for fear of these steep falls or rug-pulls. The fear isn’t completely unwarranted, as stocks can and do become “overbought” in their journey to new highs, but that’s part of the process of owning good stocks over the long haul. This fear is perhaps also a post for another time (“good” overbought versus “bad” overbought).
In addition to David Keller, let’s see what a hedge fund legend has to say:
“My metric for everything I look at is the 200-day moving average of closing prices. I’ve seen too many things go to zero, stocks and commodities. The whole trick in investing is: “How do I keep from losing everything?” If you use the 200-day moving average rule, then you get out. You play defense, and you get out.” -Paul Tudor Jones
With those two quotes as a backdrop, I decided to run a scan of steep one-day price drops in large-cap stocks.
A (Simple) Historical Look at the 200-day Moving Average
The following snip illustrates unique instances, over the last 20 years, of one-day price drops of S&P 500 constituents (accounting for survivorship bias) of more than 20%. According to my scan (my full scripting isn’t visible on the screen), there were 1,607 unique events across 448 different tickers (i.e., some stocks had multiple instances). As you might guess, or are wondering, 350 (or over 20% of such instances) occurred during COVID in 2020. If you’d like a full listing of these events, shoot me an email.
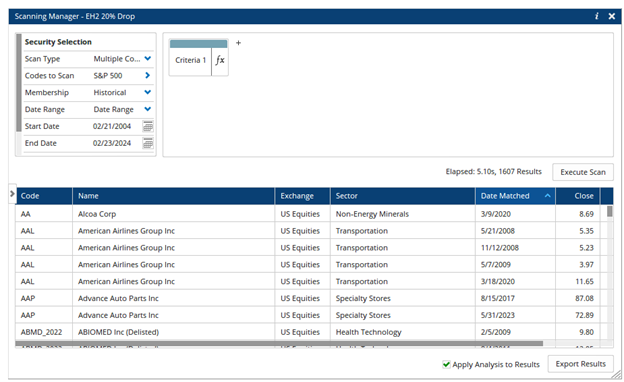
Source: Optuma
Next, I wanted to see how many of those 1,607 one-day drops occurred while the stock was above its 200-day simple moving average (specifically, when the stock’s prior close was above its 200-day SMA).
Only about 15% of our total instances (or 244, spread across 153 different tickers) occurred when the stock had previously closed above its 200-day simple moving average. So, large price declines (as we’ve defined them) above the 200D are not unprecedented, but historically-speaking, they’re not likely. And going back to 2020, there have been 63 unique instances.
- 2020: 22
- 2021: 21
- 2022: 6
- 2023: 9
- YTD 2024: 4
- Your 2024 declines include Unisys Corp ($UIS, $340M market cap), Palo Alto Networks ($PANW, $88B market cap), Teradata Corp ($TDC, $3.7B market cap) and Adtalem Global Education ($ATGE, $1.8B market cap).
- And for our clients who are wondering: Super Micro Computer ($SMCI) is not an SPX constituent and was down 19.99% on February 16th. (More on this topic during our monthly model updates).
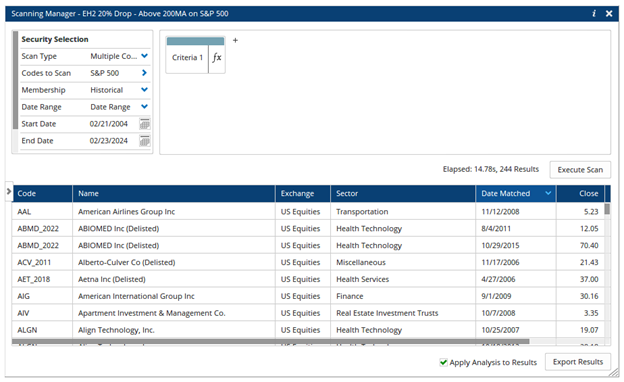
Source: Optuma
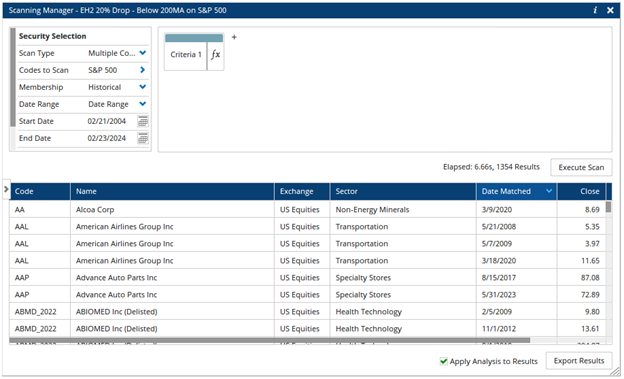
For completion’s sake, in running a scan for the opposite scenario, I found 1,354 unique instances where a stock had previously closed below its 200-day simple moving average and subsequently went down 20%+ in the following session. Combined with the prior section, this seems to confirm the suspicion that these types of one-day price shocks are likely detectable or perhaps preventable through some sort of trend analysis. Since 2020, there have been 434 such instances:
- 2020: 328
- 2021: 9
- 2022: 40
- 2023: 54
- YTD 2024: 3
Your 2024 declines include Archer-Daniels Midland ($ADM, $28B market cap), Big Lots ($BIG, $117M market cap) and The E W Scripps Company ($SSP, $451M market cap).
Programming note part 1: astute readers might be wondering how on earth companies like $BIG and $SSP could possibly be in the S&P 500 with sub-$1B market capitalization – the answer is that my scan included historical SPX constituents (survivorship bias!) over the past 20 years. $BIG was removed from the SPX in 2023, while $SSP was removed in 2008. So, this analysis could be further refined without including this conservative process.
Programming note part 2: I am aware that 1,354 and 244 do not add up to 1,607 – we are 9 instances short. I am working out this data “kink,” but I suspect that my scripting does not account for stocks than closed directly on their 200-day – I am working on resolving this.
Source: Optuma
The Takeaway? Not Silly. Not Seismic. But it is a Good Starting Point
To conclude, I feel moderately confident in confirming the intuition that the 200-day moving average is a good starting point for thinking about a risk management framework, at least when it comes to investing in individual stocks. Paul Tudor Jones wasn’t crazy in his assessment that a good starting place, for risk management, is looking at a longer-term moving average. The 200D isn’t a unique indicator with promises of an easy path to riches, but it does seem to be a fairly good “blunt tool” for potentially avoiding disaster (i.e. 20%+ price declines) in individual equities.
The flip side of this: for any DIY investor, it will take dedication and ongoing monitoring of positions, and in an effort to keep yourself insulated from precipitous drops, you also likely take yourself out of some pretty feisty “mean reversion” moves or the start of new long-term uptrends. You can’t have your cake and eat it too, unfortunately.
For Monument Wealth Management clients invested in our single stock Dividend and Growth models, the 200-day SMA is not an explicit input in our methodology, but as a byproduct of our point & figure charting data, we more often than not find ourselves in tickers above the moving average.
Related: Business Owners Now Have More Options for Success Thanks to New Legislative Changes