
Trending

In the fastest bull market in history, the S&P 500 doubled from its pandemic lows. While this is undoubtedly a newsworthy milestone, what does history suggest happens next?
As noted by CNBC:
“Here’s a market milestone to encapsulate the stunning recovery rally. The S&P 500 doubled its level from its pandemic closing low.”
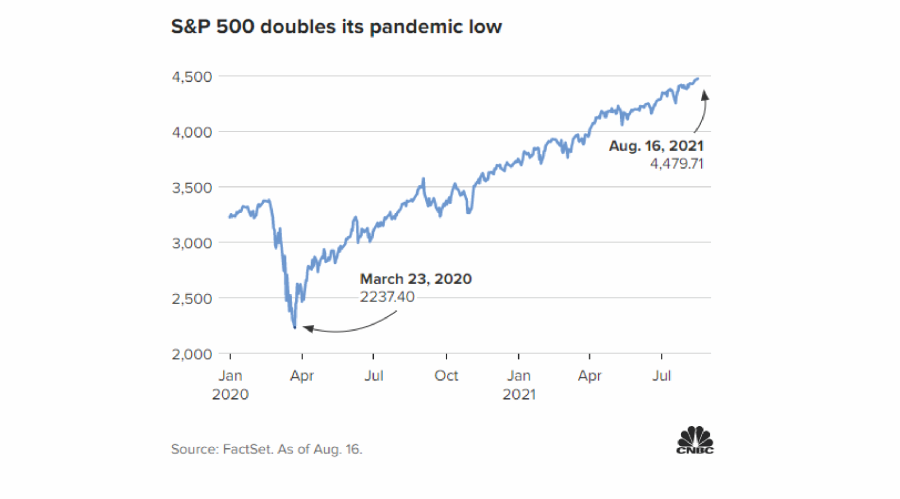
“The broad equity benchmark has rallied 100% from its Covid trough of 2,237.40 on March 23, 2020 on a closing basis. It took the market 354 trading days to get there, marking the fastest bull-market doubling off a bottom since World War II, according to a CNBC analysis of data from S&P Dow Jones Indices.”
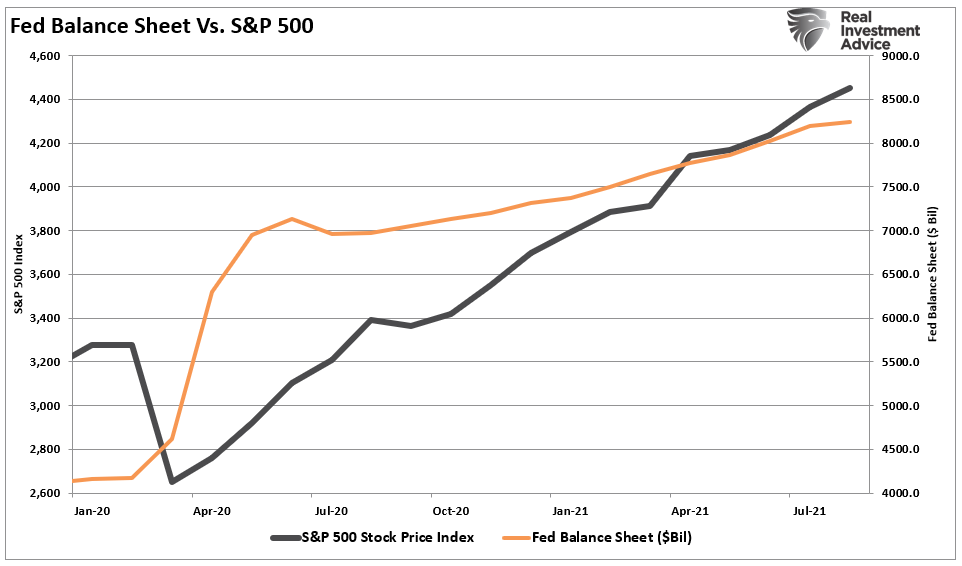
Of course, the rally from the pandemic lows is less about the “economic recovery” and more about $120 billion a month of Fed liquidity.
Nonetheless, it has been a significant rally, although rampant with speculative activity. So the question we need to ask is what does history tell us about what happens next?
A Look At Historical Doublings
A recent chart from LPL shows the history of market “doubles.” Notably, it usually takes the markets several years to double from previous lows.
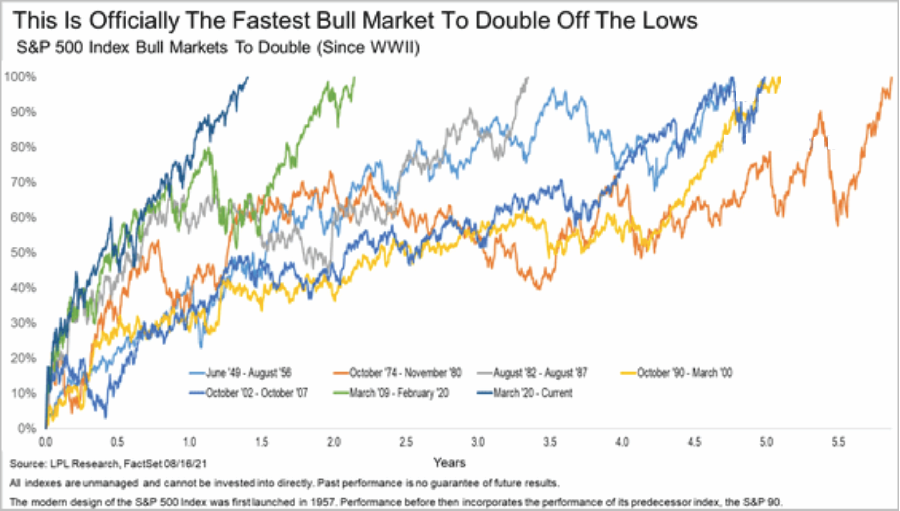
However, the chart lacks context.
- These “doubles” from previous lows means a significant “bear market” event preceded them; and,
- It tells us little about what happens next?
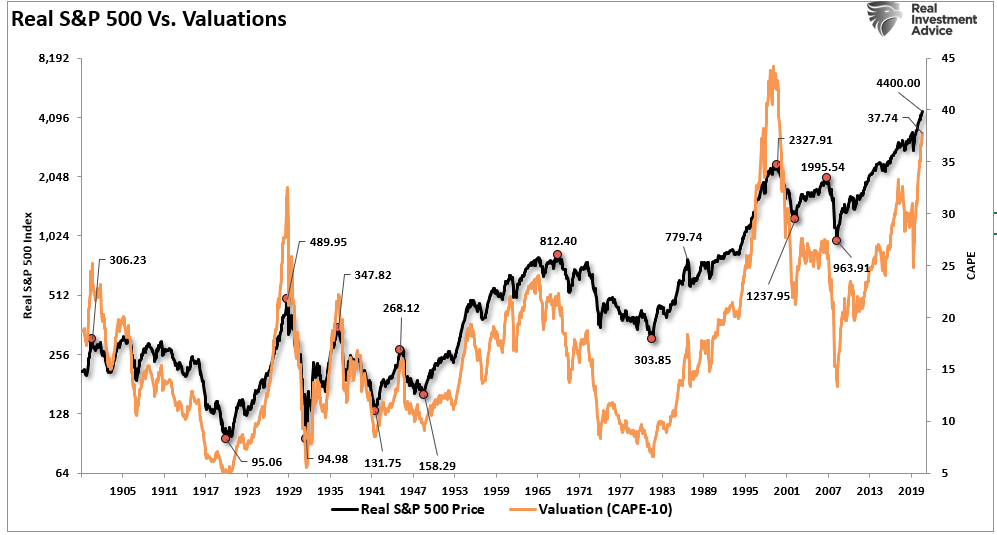
The chart below shows the historical monthly S&P 500 using data from Dr. Robert Shiller. The highlighted periods are where the market doubled from a previous low.
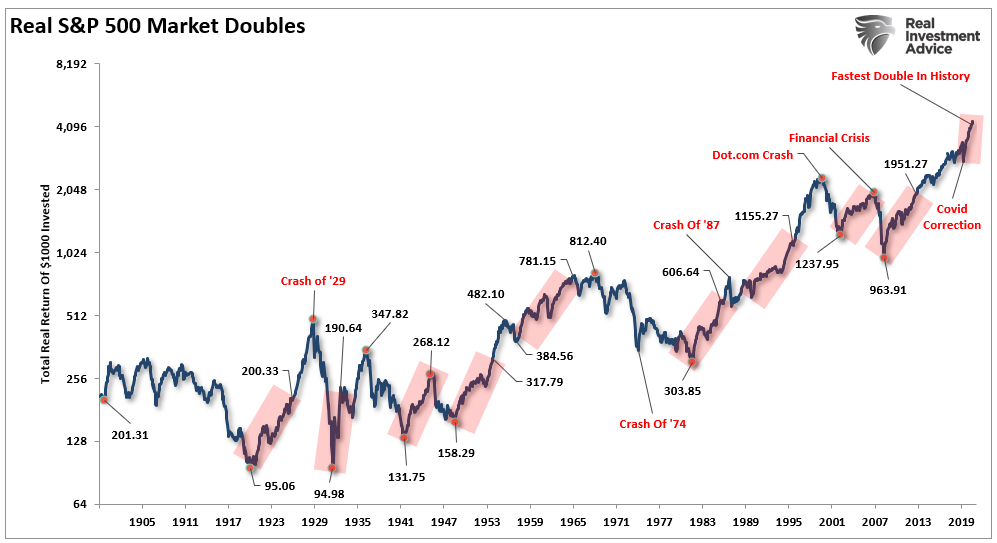
The “red highlights” represent when the market initially doubled from a previous low. First, let’s review the LPL periods noted in the first graph.
1949-1956: The market rallied further before declining by 20%. That correction led to a second double that coincided with a level not revisited until the mid-1980s.
1974-1980: The market double followed one of the worst bear markets in history. Unfortunately, the entire gain, on an inflation-adjusted basis, was lost by 1982.
1982-1987: The crash in 1987 followed the rally from the 1982 lows.
1990-2000: The market doubling in the 1990s ended in the “Dot.Com” crash.
2002-2007: Following the Dot.com crash, investors who just recovered losses got hit by the “Financial Crisis.”
2009-2020: The liquidity-driven rally from the 2009 lows is the strongest advance in history. The March correctionsurprised investors, but the pump of liquidity revived the “animal spirits.”
2020-Present: The fastest doubling of the market in history occurs at a time of peak valuations, economic, and earnings growth.
It is worth noting that despite 4-doublings from the lows, investors in 1905 didn’t break even until 1955 (That’s 50-years of zero returns.)
Notably, throughout history, uninterrupted market advances are always met by corrections, bear markets, or worse.
But not always immediately. The longer historical market advances all have a common ingredient.
Valuations Matter
As shown, when the market doubled from preceding lows, there were often corrections and bear markets before the next leg of the advance began. The distinguishing factor to these periods where the market doubles and then continues to run is starting valuations.
Not surprisingly, and discussed previously, starting valuations have much to do with future return expectations. What is often forgotten by investors, especially during robust bull markets, is the subsequent and inevitable bear market.
While the jump in earnings and profits surged from the pandemic lows, valuations were not allowed to revert, as would typically be the case during a recession. If valuations corrected during the pandemic-driven shutdown, as prices fell and earnings surged, a more sustainable case might exist.
However, the earnings recovery got absorbed by the speculative, liquidity-driven market surge. Such leaves the markets vulnerable to a disappointment in earnings, a slowing of economic growth, or a reduction in liquidity flows into the markets.
Valuations are a terrible market timing indicator. However, they represent the speculative psychology of market participants which has eventually and always ended poorly.
More Headwinds Than Tailwinds
While the mainstream analysis wants investors to take “the fastest doubling of markets in history” as a sign more gains are to come, history suggests caution.
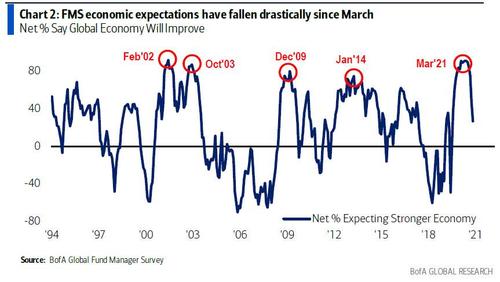
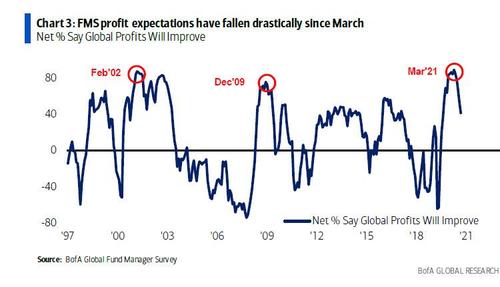
As noted above, there are likely more headwinds to a further advance than many realize. Weaker economic growth and earnings will make it more difficult to support high prices. AsBofA recently noted, global expectations are beginning to roll over from very high levels. Such has typically not worked out well for investors.
When you add higher inflation levels, which is outpacing wage growth, and a reduction in liquidity to a weakening economy, the pressure on margins will likely be higher than anticipated.
While none of this means that investors should “sell everything” and hide in cash, it does suggest a more logical approach to risk management is required.
There remains an ongoing bullish bias that continues to support the market near term. Bull markets built on “momentum” are very hard to kill. Warning signs can last longer than logic would predict. The risk comes when investors begin to “discount” the warnings and assume they are wrong.
It is usually just about then the inevitable correction occurs. Such is the inherent risk of ignoring risk.
Investors would do well to remember the words of the then-chairman of the Securities and Exchange Commission Arthur Levitt in a 1998 speech entitled “The Numbers Game:”
“While the temptations are great, and the pressures strong, illusions in numbers are only that—ephemeral, and ultimately self-destructive.”