
Trending

Written by: Scott Stolz
According to the Life Insurance Marketing and Research Association (LIMRA) 2021 study on structured annuities, almost half of all structured annuity sales utilized a strategy term of five or six years. The other half was broken down between one and two-year indexed terms.1 So why are so many advisors choosing to make their clients wait five or six years before interest gets credited to the policy? It’s my opinion that the majority of advisors choose a strategy with the primary objective of avoiding a negative return. Maximizing growth is a secondary goal once the desired level of protection is chosen.
If my assumption is true, then longer term strategies make perfect sense. After all, if I go out six years and combine this with a 10% buffer, there’s a slim chance that a client will experience a loss six years later. But how slim? Fortunately, iCapital’s platform for annuities can help answer that question.
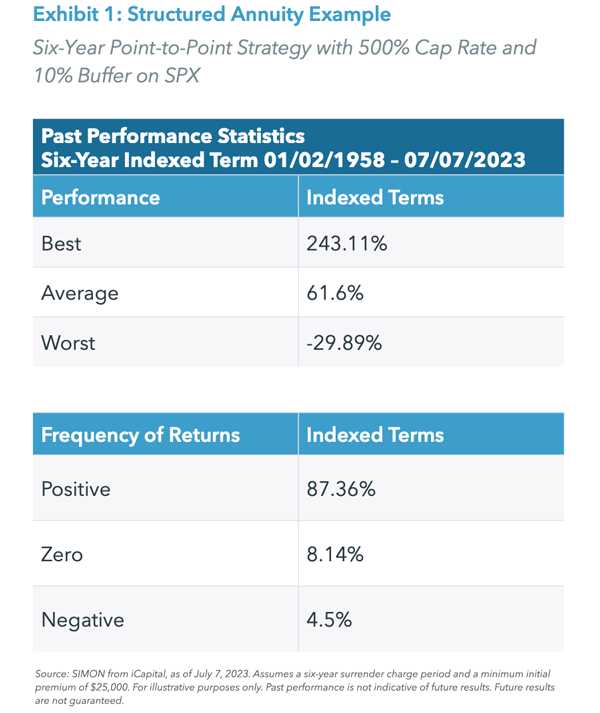
Let’s take a look at an example of a structured annuity with a six-year point-to-point strategy with a 500% cap rate and 10% buffer on the S&P 500 (SPX). Using the iCapital platform, we can view the hypothetical performance metrics across six-year indexed terms between January 2, 1958 and July 7, 2023. We find that during this period, the index dropped in price more than 10% only 4.5% of the time over any rolling six-year period, and the average six-year return based on a 500% cap rate would have been 61.6%, or 8.33% per year.
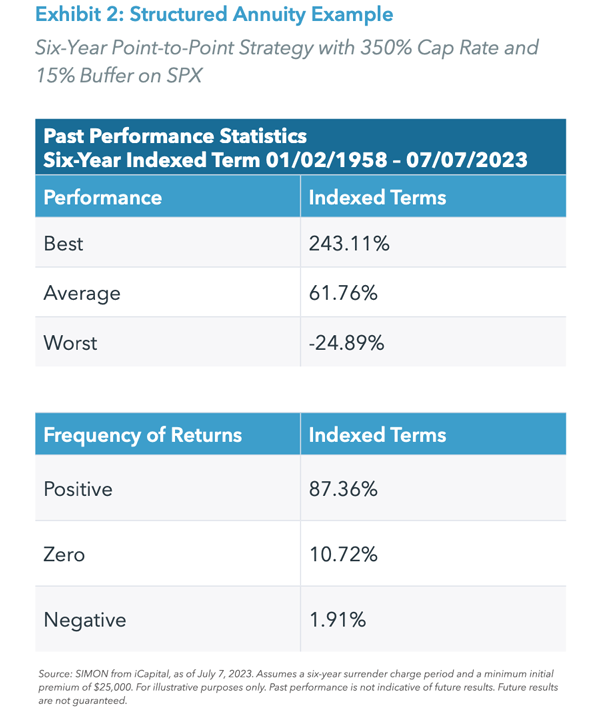
Take another example of a structured annuity with the same six-year point-to-point strategy, but with a 350% cap rate and 15% buffer on SPX. During this same period, the hypothetical performance metrics show the percent of negative returns falls to just 1.91%. And how much upside do we give up? None. In fact, we actually gain upside by choosing the higher buffer with the lower cap rate. Why? Because the SPX has never increased in price more than 243.11% over any rolling six-year period. Therefore, unless we experience a historic bull market, both the 350% and 500% cap rates are effectively uncapped options. By eliminating some of the negative returns via the higher buffer and lower cap rate, we actually slightly increase historical average returns to 61.76%, or 8.35% per year.
From these examples, we can observe with six-year indexed terms, a buffer of at least 10% does indeed provide a great deal of protection.
Comparing six-year indexed terms to one-year indexed terms
The next question we must ask is how does a six-year indexed term compare to a one-year indexed term?
Let’s first take a look at an example of a structured annuity with a one-year point-to-point strategy with a 19.5% cap rate and 10% buffer on SPX. Again, we will go to iCapital’s platform to analyze the hypothetical performance.
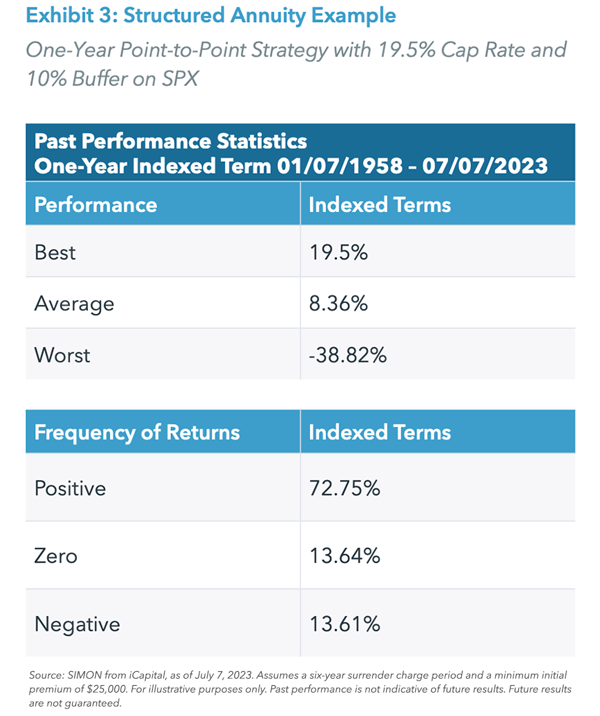
Using the iCapital platform, we find that across one-year indexed terms between January 7, 1958 and July 7, 2023, the best possible one-year return is obviously equal to the 19.5% cap rate, and the average one-year return would be 8.36%, slightly better than the 8.33% per year generated by the six-year point-to-point strategy with a 500% cap rate and 10% buffer on SPX. But then we see the worst possible one-year return of -38.82%. That means there was a one-year period where SPX fell 48.82%, leaving a negative return of 38.82% after the 10% buffer. Not a good outcome for the client.
In addition, the 10% buffer would have failed to fully protect the client 13.61% over the time period. In other words, in one out of every eight years an advisor would have to tell the client that, while it could have been worse, the value of their structured annuity dropped during the year.
The high usage of the longer term strategies tells me that advisors are trying to avoid that conversation. And at first glance, it appears as though they are making the right choice. After all, why almost triple the odds of a negative return if the historical average returns are very similar?
The Value of the Annual Reset
But let’s remember that we are not buying the structured annuity for just a year. If it’s a commissionable structured annuity, it likely comes with a surrender charge period of five or six years. Even if it’s an advisory structured annuity, you’re likely planning to have the client own the annuity for five to 10 years, otherwise they are not getting much benefit from the annuity’s tax deferral. Assume for a moment we just finished one of those down years. The next year’s results will be based on the now lower price of the SPX. Unlike the longer term strategy, the client does not have to wait until the market recovers to see gains in subsequent years because the index strike price is reset at the lower price.
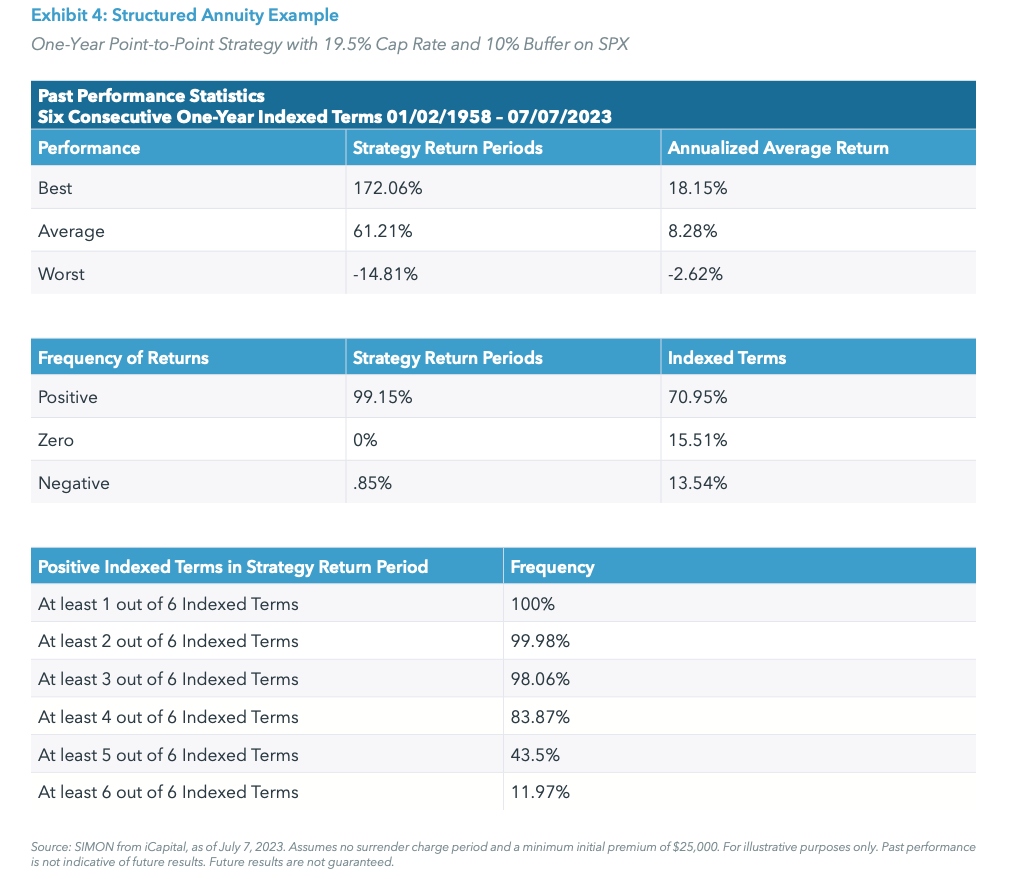
Therefore, to compare apples to apples, we need to compare the results of the six-year indexed term to the results of six consecutive one-year indexed terms. Fortunately, we can also perform this analysis within the iCapital platform by viewing the hypothetical performance across six consecutive rolling one-year indexed terms, rather than a single year. In other words, we are now looking at an indication of how the policy would have performed over the entire surrender charge period.
When we look at rolling six consecutive one-year indexed terms, we see a much different picture. Due to the reset in the index after a down year, there is an increased chance of getting a positive return the following year, thereby smoothing out returns over the surrender charge period. In fact, we can see from iCapital’s data that while our historical average annual return is essentially the same (8.33% and 8.35% for the six-year strategies vs. 8.28% for the one-year strategy), our historical negative returns over the entire six-year period falls to less than 1% – even less than the six-year point-to-point strategy with a 15% buffer on the very same index. Based on the data, we can also observe that this particular approach likely led to a zero negative return in one or two of those years. Therefore, while lower negative returns have resulted over the full six-year surrender charge period, some years did incur a loss of principal.
Conclusion
The good news is that given today’s higher rates, any of these strategies are likely to provide acceptable returns with mitigated downside risk. If the goal is to minimize the chances that your client will receive a negative return at the end of a selected strategy term, then the choice of a structured annuity with five or six-year indexed terms and at least a 10% buffer will serve that objective. But, if the goal is to give the most protection during the entire surrender charge period, then a structured annuity with successive one-year indexed terms, with a reset the index level each year, may be a better solution.
Related: Multi-Strategy Investing: Delivering Uncorrelated Sources of Return
ENDNOTES
1. LIMRA, A Deeper Dive: 2021 Registered Index-Linked Sales