
Trending

Written by: Marina Valentini
Emerging market equities are off to their best start since 2017, surging 10% year-to-date and outperforming developed markets (MSCI World) by 6%. This is mostly driven by U.S. underperformance - once the U.S. is excluded, EM still trails ex-U.S. developed markets (MSCI EAFE) by 8%. As investors reassess U.S. exceptionalism and seek broader diversification, DMs like Europe and Japan are reaping the greatest rewards. However, EMs should not be overlooked as potential portfolio diversifiers. Four factors suggest the case for EM equities is improving:
- Solid EM fundamentals: The EM-DM growth gap is set to remain robust at 2.5% in 2025, with most EM central banks easing rates. MSCI EM earnings growth is expected to accelerate to 17% this year, up from 10% in 2024. In China, stabilizing data suggest stimulus measures are finally taking effect. Though real estate and tariff headwinds persist, the prospect of a cyclical upturn in China could lift EM sentiment.
- De-escalation of trade tensions: The U.S.-China tariff pause meaningfully improves the outlook for EM assets. While certain EM Asian countries such as Vietnam remain vulnerable to reciprocal tariffs after the 90-day pause, especially if the U.S. targets transshipments, others are more insulated. India stands out given positive trade discussions and domestically-oriented economy. As tariff uncertainty fades, investors may refocus on India's growth story, fueled by favorable demographics, reforms and friendshoring. Latin America has been mostly spared from reciprocal tariffs, including Mexico as it renegotiates the USMCA.
- “Soft tech” over “hard tech”: Faster AI adoption, led by DeepSeek, is fueling strong performance in software and IT services sectors. MSCI China (which includes offshore-listed H shares and carries a 37% weight in soft tech) has rallied 17% YTD - sharply outperforming onshore China A shares which have just 3% exposure to soft tech and are roughly flat YTD. This performance gap could narrow as China's domestic outlook improves, though the soft tech rally is likely to continue. MSCI Taiwan, with a 78% weight in hard tech, has underperformed. Meanwhile, despite its hard tech focus, Korean equities have risen 18% as political noise has faded and corporate reforms accelerate.
- Currency and valuation tailwinds: EM’s historical underperformance relative to DM – lagging by an annualized 6% since 2010 – has coincided with a prolonged dollar strength period. With the DXY index down 9% YTD, that headwind may be easing, potentially driving greater EM flows. Valuations also remain attractive: MSCI EM trades at 12.4x earnings, near its 25-year average.
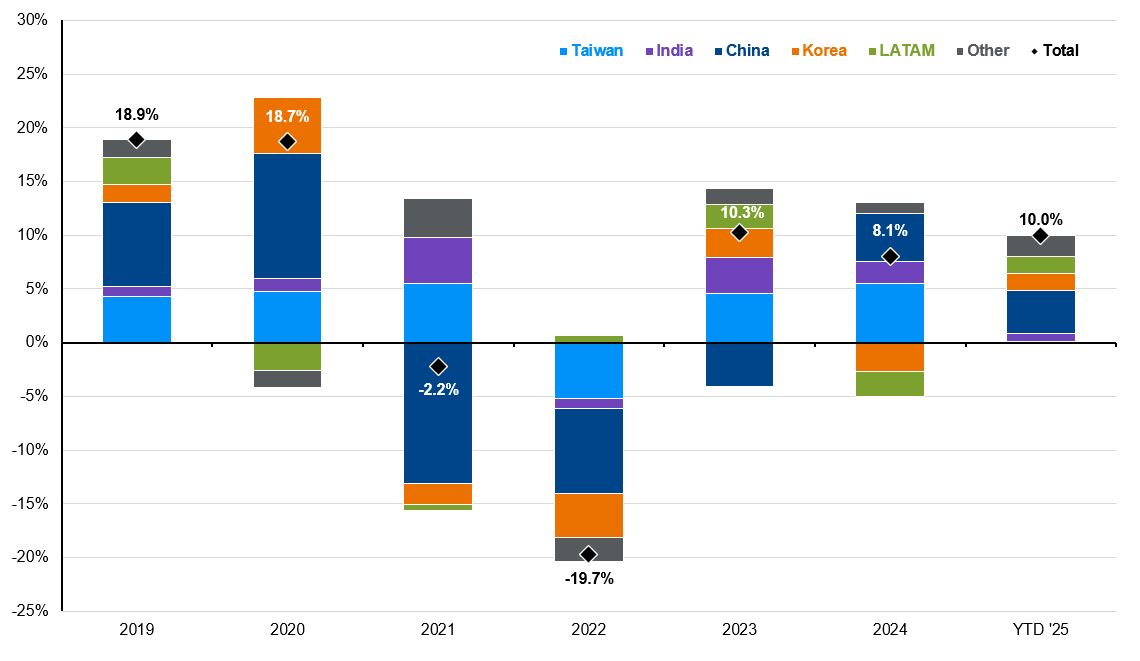
EM remains under-owned, with its global AUM share dropping to 5% from 8% in 2017, and stands to benefit from powerful rotation trades from past winners to less favored markets. Leadership has also shifted within EM - from regions with stellar returns in 2022-24, like Taiwan and India, to laggards such as Korea and LATAM. Each year tells a different story and EM companies face unique domestic and external challenges. A long-term and active approach, focusing on structural trends such as friendshoring, technological innovation and the EM consumer boom, remains crucial.
EM winners of recent years are stepping back as former laggards catch up
MSCI EM Index, country contribution, total return, USD
Source: Bloomberg, MSCI, J.P. Morgan Asset Management.
Chart is for illustrative purposes only. Past performance is not indicative of future results.
Data are as of May 27, 2025.
Related: From Hype to Action: How Businesses Are Actually Using AI