
Trending

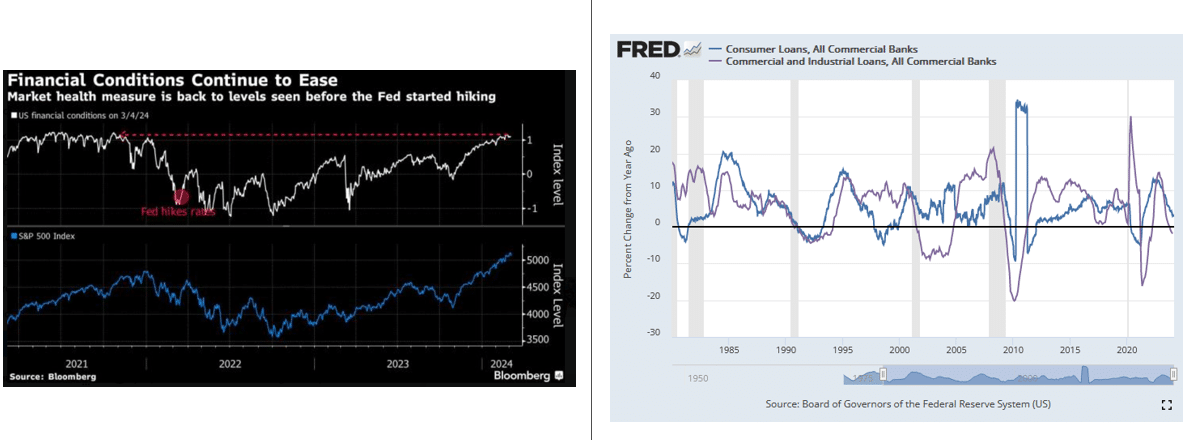
The Fed is doing QT and keeping interest rates at 15+ year highs. Mortgage rates are 7%, credit cards are around 20%, and auto loans are between 7% and 10%. As the graph below on the right shows, consumer loan growth, excluding the pandemic, has fallen to levels last seen over ten years ago. Loan growth to companies (C&I) is declining and, again, excluding the pandemic, at rates last seen during the 2008 recession. So why, as the Bloomberg chart on the left highlights, are financial conditions so easy?
Few appreciate the big difference between financial conditions and borrowing conditions. Financial conditions predominately measure markets. The St. Louis Fed defines financial conditions as follows: “Measures of equity prices (also commonly referred to as stock prices), the strength of the U.S. dollar, market volatility, credit spreads, long-term interest rates, and other variables.” In the short term, markets are fueled by liquidity and sentiment. As we describe in Liquidity Problems, despite QT and high rates, there remains an abundance of liquidity in the financial system. Furthermore, market sentiment is sky-high. For now, markets do not care about borrowing conditions, but at some point, maybe they will.
Economy
Market Trading Update
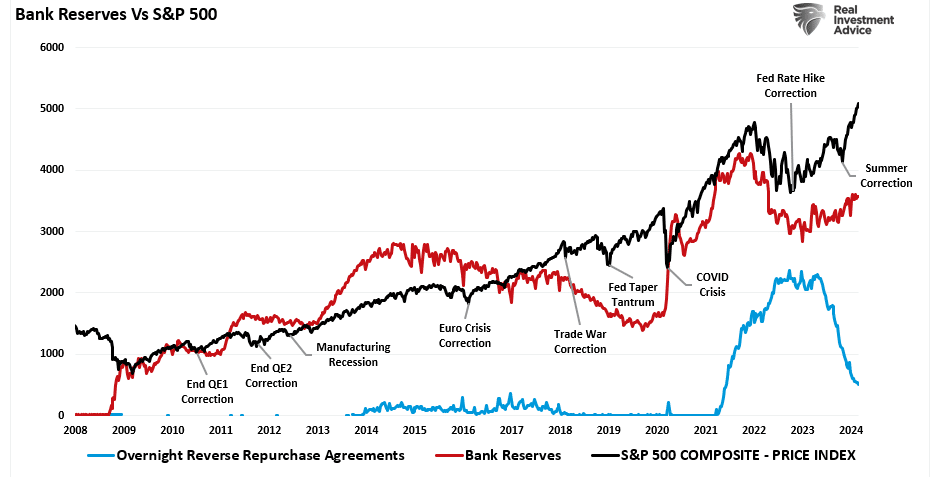
As noted yesterday, the market continues trading within its very confined range. Dips are quickly bought, which should be expected given the market sentiment. As noted above, financial conditions remain supportive of rising asset prices. Bank reserves also remain supportive despite the drop in liquidity, as noted by the decline in the repo programs. History suggests that the markets will participate as long as bank reserves continue to rise. However, if bank reserves come under pressure due to a liquidity event in the financial system, a market correction becomes much more likely.
There is no evidence of that weakness yet. For investors, it is important to understand that markets are likely entering a topping phase. Simon White at Bloomberg had a excellent comment on this point.
“The stock market is entering its topping phase. That’s not necessarily a reason, however, to hit the sell button as market tops typically persist long after fundamentals have ceased to support them, making them fraught with risks. The current market has yet to display the majority features present at previous tops, suggesting it can keep grinding higher — perhaps even culminating in a blow-off in prices — despite growing skepticism in the rally.
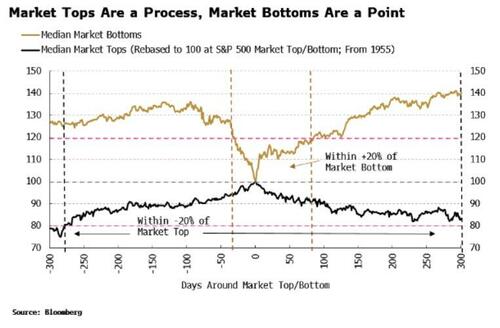
Markets exhibit asymmetric behavior at tops and bottoms. The latter are points in time, but tops are a process, often lasting many months. The most recent ones: the pandemic in 2021, the subprime crisis in 2007, the 2000 tech bubble and the savings and loan crisis in 1990 lasted many months – with the exception of the pandemic – and endured mounting disbelief before they finally gave way.
The stark difference between market tops and bottoms can be seen in the following chart. It shows the median bull market and the median bear market of the last 70 years. We can see clearly that market tops take many months to build, forming an inverted U-shape, and spending a significant amount of time within 20% of their peak price.“
Trade accordingly.
NYCB Is Given A Lifeline, But Not By Uncle Sam
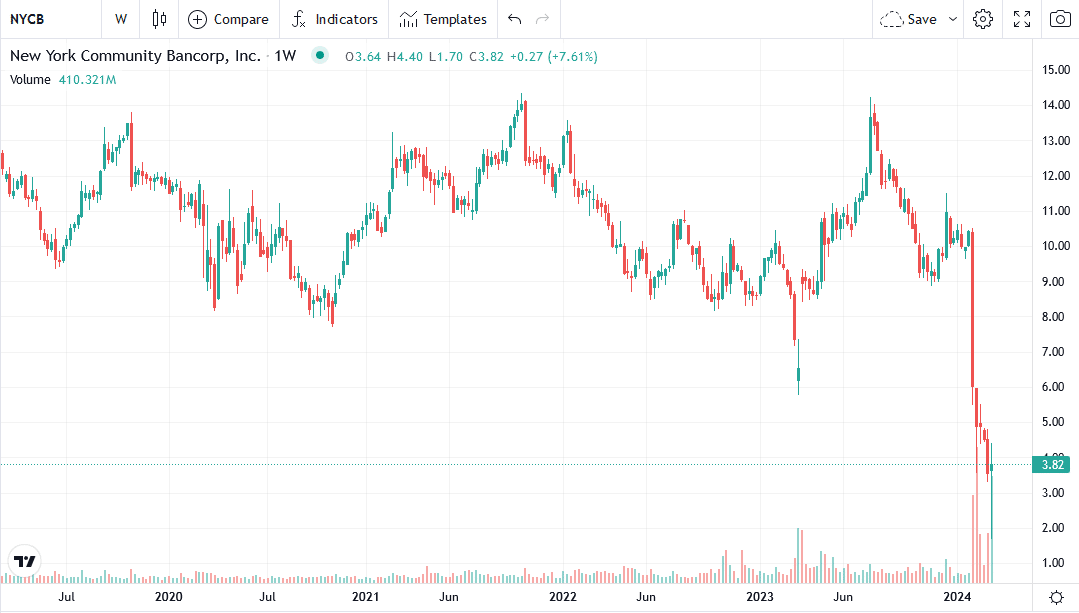
NYCB was on the ropes. The bank was downgraded to junk status and in desperate need of capital. Consequently, its stock was halted as it fell almost 50% on Wednesday due to concerns that it could fail without new capital. It turns out the bad news expected after the trading halt was good news. A group of investors led by former Treasury Secretary Mnuchin and Fortress Capital provided the bank with $1 billion of capital. The stock opened Wednesday at $3.64, traded as low as $1.70, and closed up on the day.
For now, it appears NYCB is stable. Furthermore, the capital providers require the removal of NYCB’s entire management. We do not know whether NYCB will survive, but we like that the bailout will occur by the private sector without the government’s or Fed’s financing. This is how the system should work.
More On The JOLTs Quit Rate
Yesterday’s Commentary stated:
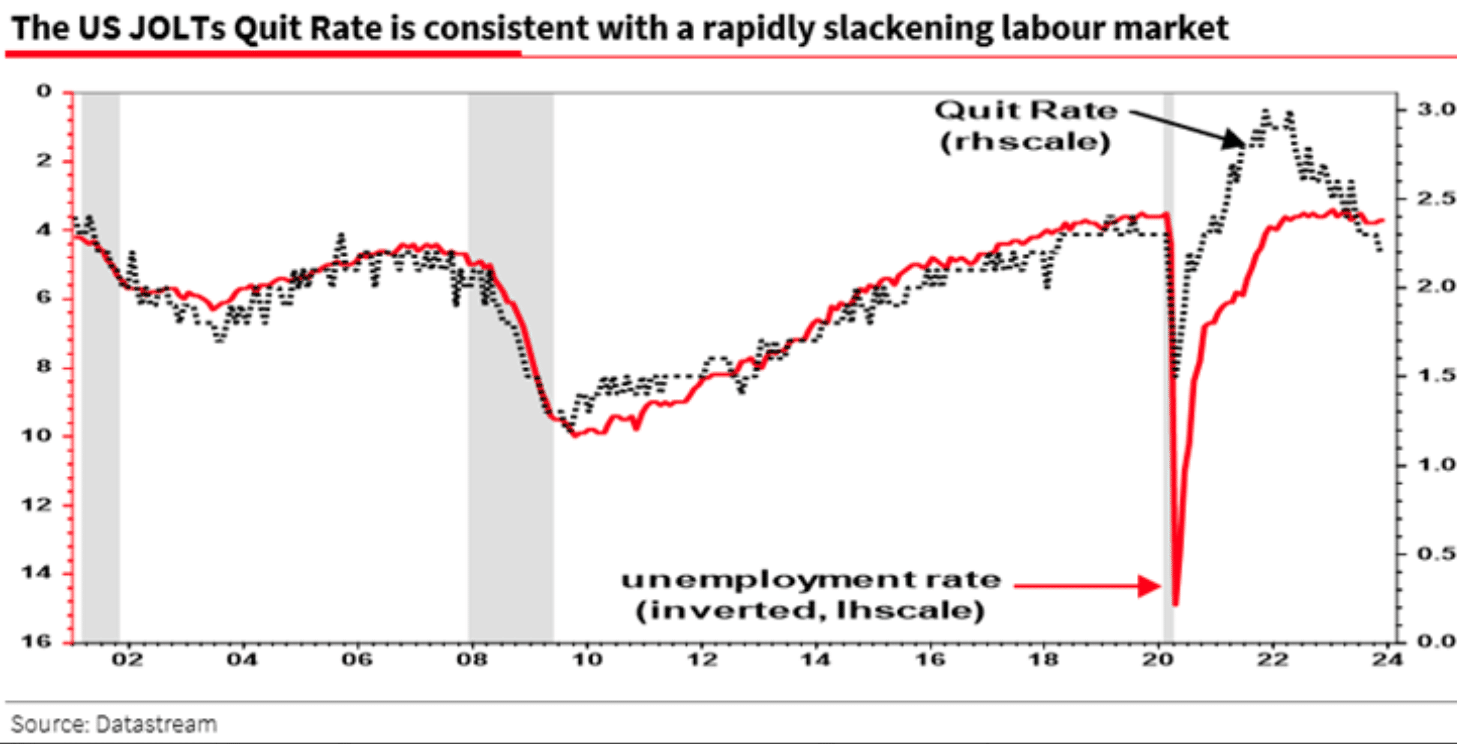
The quit rate, a good measure of job mobility, is now below pre-pandemic levels.
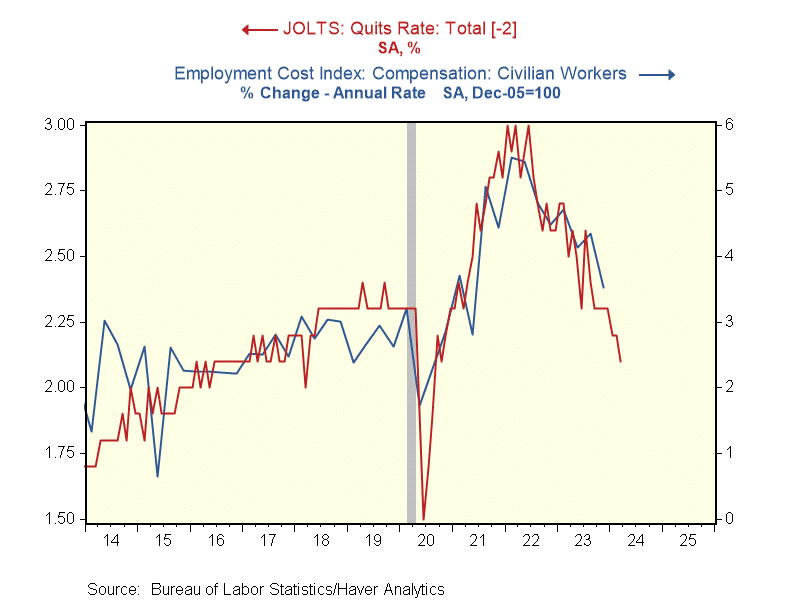
The quit rate is a great predictor of employment and wages. The first graph, courtesy of Albert Edwards, shows the robust correlation between the quit rate and the unemployment rate. While it is currently diverging, the quit rate tends to be a leading indicator, meaning that unemployment may increase soon. In like manner, the second graph shows a strong correlation between wages and the quit rate. In this graph, the quit rate leads by two months. Assuming the relationship holds, wage growth should continue falling, which should make the Fed more comfortable in its quest to reduce inflation.
Tweet of the Day
“Want to have better long-term success in managing your portfolio? Here are our 15-trading rules for managing market risks.”
Related: Proximity Alert: Recognizing the Imminent Threat of Liquidity Issues