
Trending

Forgive me for being blunt, but…
Most folks don’t know the first thing about measuring how cheap a stock is.
Which is a shame… because buying dominant stocks on the cheap is probably the easiest and lowest-risk way to grow your wealth in the markets.
Especially today. Because many dominant disruptors are trading for multiyear-low valuations.
If you’ve ever been bewildered by stock market valuations, it’s not your fault. Few things are more confusing than stock market valuation metrics—which are supposed to tell us how expensive or cheap stocks are.
Problem is, there are dozens of valuation metrics. And they all give different answers.
The “Buffett indicator,” which compares stock prices to US Economic Output, says stocks are very expensive right now.
The CAPE ratio, which considers companies’ long-term earnings, says stocks are reasonably priced right now.
The market’s price/earnings (P/E) ratio gives a different perspective. Its price/revenue (P/R) ratio gives yet another.
It’s a lot of conflicting information. And it tends to paralyze investors into doing nothing.
I suggest you set all that aside and instead focus on the one number that can’t lie…
Cold, hard cash is like truth serum for stocks.
Free cash flow (FCF) tells us the amount of cold, hard cash coming into a business. It measures how much cash flows into a company’s coffers after it pays the bills and makes investments.
Unlike earnings, FCF is nearly impossible to fake, massage, or manipulate.
If you’re not familiar with FCF—that’s okay. It gets completely overshadowed by earnings in the financial press.
Earnings, also called Net Income, are the accounting profit earned by a business. Earnings are similar to free cash flow.
But there’s one big difference.
Earnings are subject to dozens of adjustments, set forth by accounting rules. Although these rules mean well, they give a company’s accountants leeway to apply “creative” assumptions and judgment to the numbers.
Long story short, earnings are subjective. They can lie.
FCF is objective.
Cash always tells the truth.
So why doesn’t everyone focus on FCF?
Simply put: cash flow is lumpy.
Unlike earnings growth, which tends to follow a smoother path, cash flow often jumps around. Part-time investors who casually follow a stock have a hard time making sense of cash flow, so they usually ignore it.
Take Amazon (AMZN), for example.
Amazon is an all-time great company. It dominates e-commerce and cloud computing, two pillars of the modern economy.
Look at this chart of Amazon’s free cash flow. After years of steady growth, its cash flow plunged to negative last year. And has plunged even further this year. Based on this data alone, you’d think something was seriously wrong with the company.
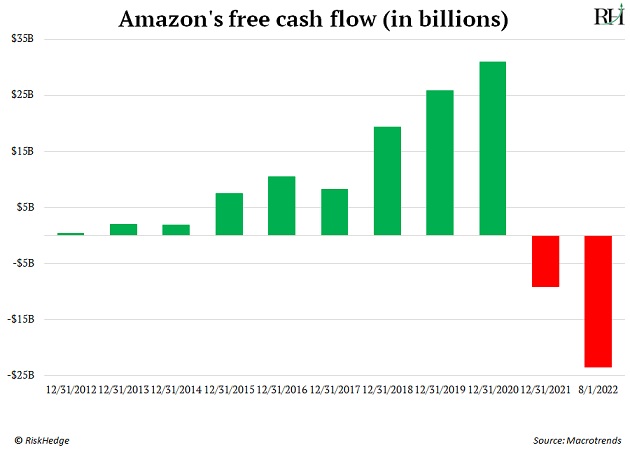
In fact, Amazon has invested nearly twice as much money in its business in the past 10 quarters than it did in its entire 25-year history before that.
All this investment—about $132 billion over the past two and a half years—blew a hole in its FCF.
That looks bad on a chart, without context. But it’s actually a great thing, because Amazon will reap the benefits of faster delivery and more cloud computing power for years to come.
Amazon is also winding down its record spending. So FCF should surge in the coming years.
My point is… you wouldn’t realize any of this unless you were extremely familiar with the company. FCF is an extremely powerful metric… but its lumpiness frustrates the vast majority of investors from using it effectively.
Their frustration is our edge.
Once you truly understand a company’s FCF, you’re already ahead of 99% of investors.
From there, you can compare its FCF to the price of its stock—to get the P/FCF ratio.
This is, hands down, the most powerful valuation metric for large stocks.
Look at Alphabet (GOOGL), the parent company of Google. Its stock is down more than 23% from its split-adjusted 52-week high as I write. As a result, its P/FCF ratio has fallen to 22.2.
That’s cheap. In fact, GOOGL hasn’t been this cheap since mid-2019. Had you bought it then, you’d be sitting on a profit of about 95%.
Of course, determining a great stock is cheap is just a starting point.
A cheap dominant stock must also be growing, innovating, and beating the competition.
That’s where the “dominance factor” comes into play. More on that here…
3 Breakthrough Stocks Set to Double Your Money in 2022
Get our latest report where we reveal our three favorite stocks that can hand you 100% gains as they disrupt whole industries. Get your free copy here.