
Trending

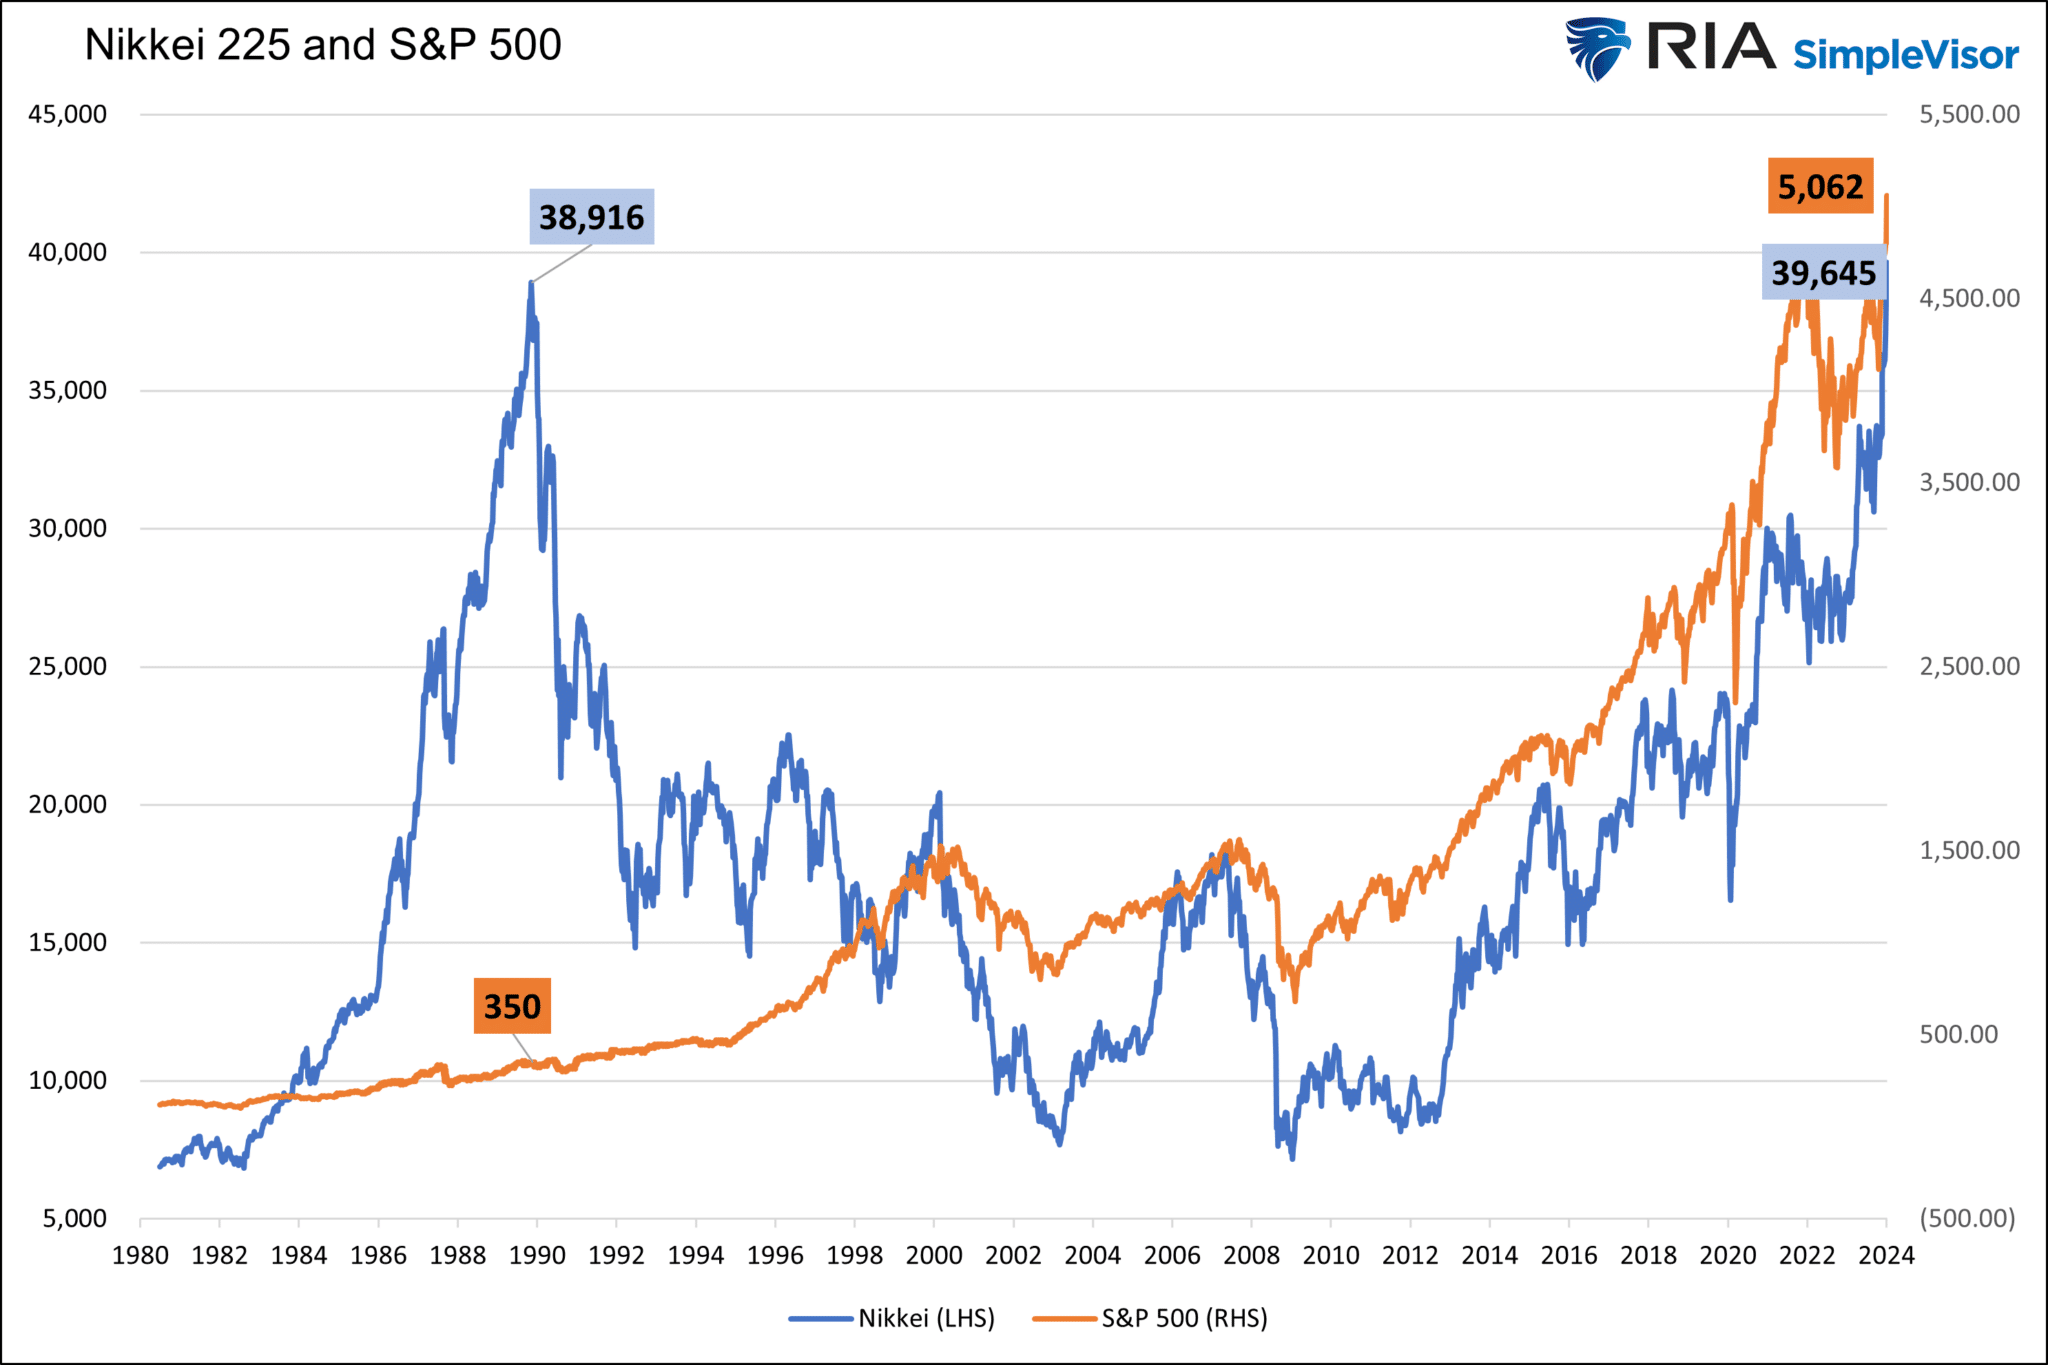
Japan is in a recession, its population is shrinking, and its debt to GDP is over 250%. However, despite their economic and demographic woes, Japan’s main stock index, the Nikkei 225, just hit a new all-time high. There is much more to the story than the Nikkei stock market diverging from fundamentals. The Nikkei is not just breaking any record; it finally surpassed the prior peak set in December 1989. Over the last 34 years, the Nikkei, excluding dividends, has provided investors a 0% return. The S&P 500 has grown by 1,346% over the same period.
After rebuilding the country from the devastation of World War 2, Japan embarked on an unprecedented economic boom. It quickly became one of the world’s leading economic powerhouses. In 1970, Japan’s GDP was $217 billion. By 1990, it rose to $3.19 trillion, an astonishing 14.4% annual growth rate. Along with an expanding economy was a speculative bubble in real estate and stocks. The bubble popped in late 1989 as stock and real estate prices tumbled. Its GDP peaked in 1995 and to this day remains below that level. It turns out the “Japanese miracle” was a function of massive speculation and unruly leverage.
Their huge economic growth rate came to a halt in the early 1990s, marking the beginning of what is termed “Japan’s Lost Decades.”
What To Watch
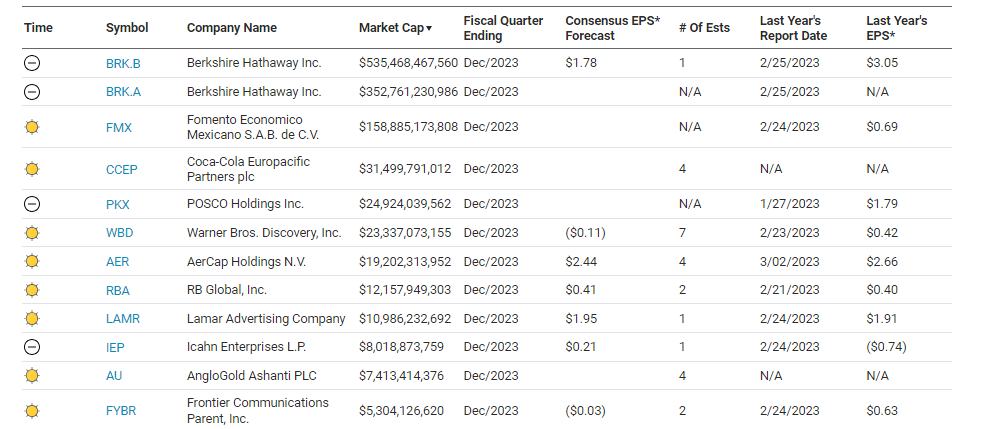
Earnings
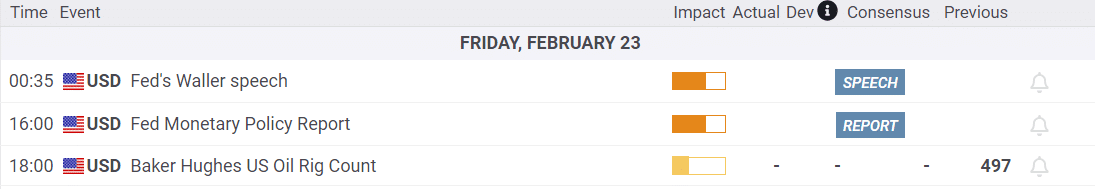
Economy
Market Trading Update
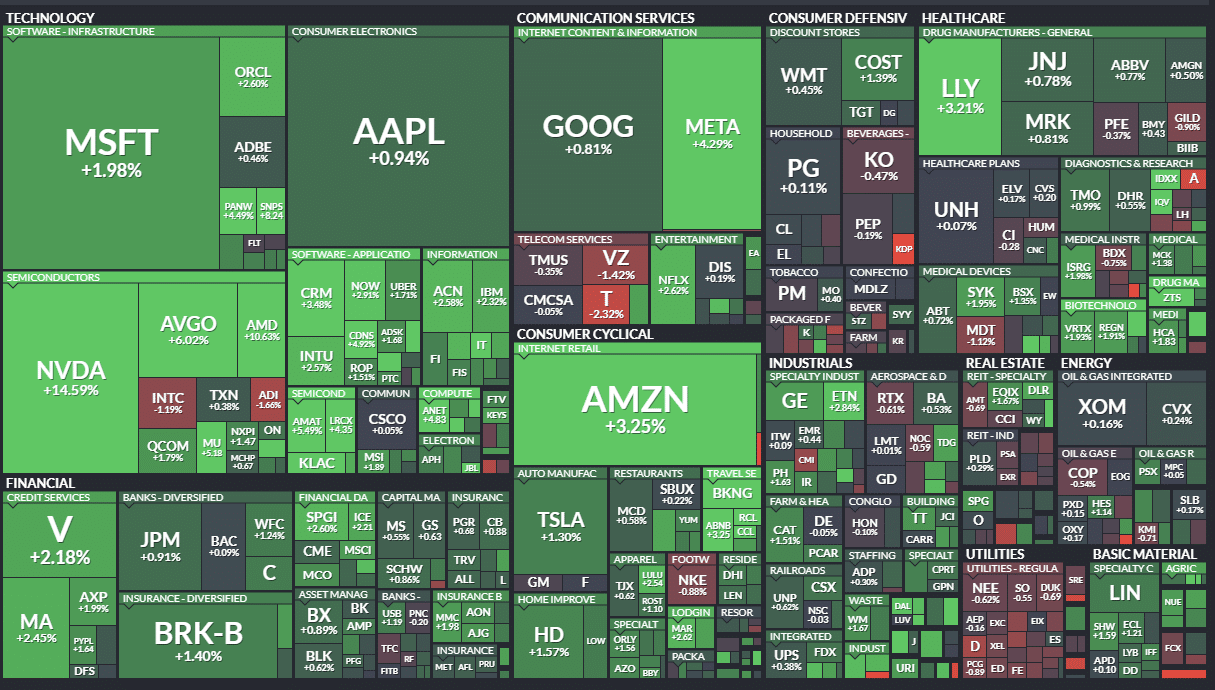
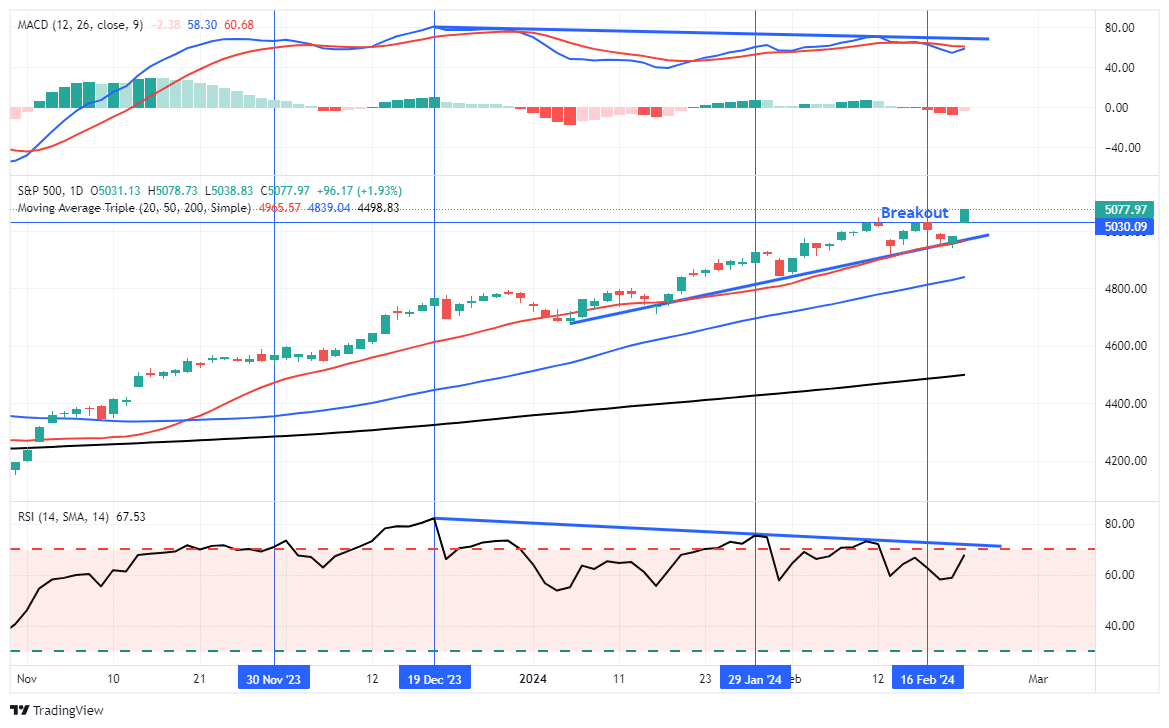
With Nvidia’s stellar earnings report Wednesday night, the market surged higher yesterday, reaching an all-time high. As discussed yesterday, the 20-DMA continues to support the bullish trend that began in November. Our only concern continues to be the negative divergence in both momentum and breadth of the market.
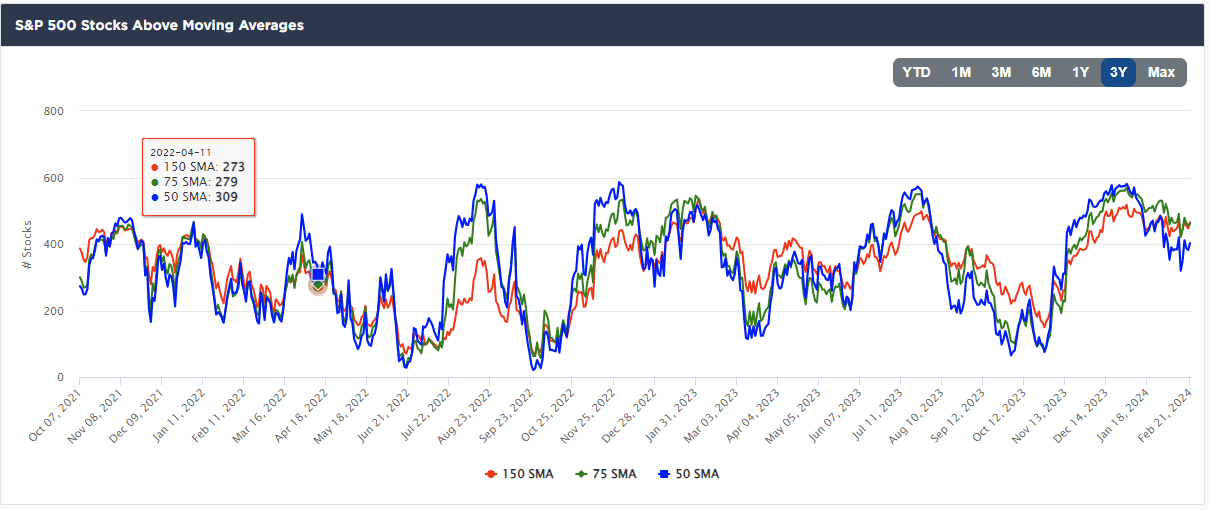
That lack of breadth continues to be evident. As shown, yesterday’s surge was almost entirely a function of the Mega-capitalization stocks and anything remotely related to artificial intelligence.
Nonetheless, the bullish trend remains firmly intact, and the breakout above the recent consolidation range sets the market in place for additional gains. However, I would suspect that with such an outsized gain yesterday, we could see a little profit-taking emerge soon. The 20-DMA is now the defacto “Maginot Line” for the markets. A failure at that level will likely lead to a deeper selloff. Continue to manage risk accordingly.
Nvidia Saves The Markets
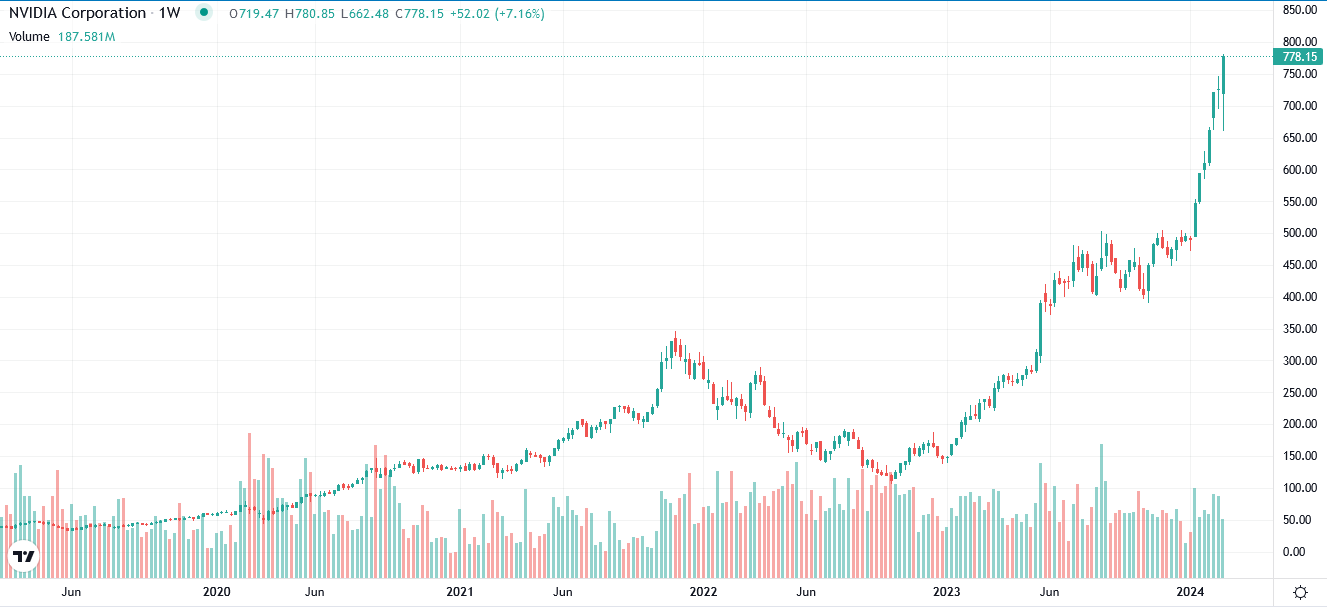
Much hype and fear surrounded Nvidia’s (NVDA) earnings announcement on Wednesday night. Some proffered that if NVDA failed to meet expectations, its shares would fall significantly and drag the market lower. Given its role in the Magnificent Seven, such turmoil could lead to a new market regime, or so some thought. Today’s Tweet of the Day shows a popular meme all over social media before their earnings. On the flip side, there was speculation the stock could soar.
NVDA again blew the doors off earnings, and its shares are up about 15%. It also provided better-than-expected guidance on future earnings. NVDA reported its earnings grew by 486% over the year on a 265% increase in sales. Its data center is its crucial driver of growth, accounting for $18.4 billion of revenue, more than 5x the amount a year ago. To put the importance of its data center chips into context, its total revenue is $22.1 billion. Lastly, the company points to solid growth ahead as it cannot satiate demand for its chips. Per its CEO Jensen Huang:
“Fundamentally the conditions are excellent for continued growth — calendar 2024 to calendar 2025 and beyond,” Huang said. “We expect that demand will continue to be stronger than our supply provides.”
What Is A Treasury Auction Tail?
The following headline scrolled across our screens this week:
Another spicy Treasury auction, this time in the 20Yr: – Tail was 3.3bps, *largest on record* for the 20Yr
Given the recent importance of Treasury auction results, we should explain what an auction tail is. The U.S. Treasury uses a Dutch Auction format to distribute its bonds. Potential buyers submit their bids with information on the desired yields and the associated amount they would buy. The Treasury orders all bids from lowest to highest and fills the orders starting with the lowest yield. Once they meet the auction size, the yield of the last bidder is then applied to all winning bids.
A tail happens when the auction yield is above the yield where the bond was trading when the auction occurred. For instance, if the market yield on a ten-year note was 4.25% when the action ended, and the calculated auction yield was 4.27%, the tail was 0.2%. The larger the tail, the “worse” the auction. Conversely, auctions can come in below the market yield. The correct terminology is “through.” For example, “the ten-year note auction traded .01% through the market yield.”
Yes, the 20-year auction was terrible, but it’s a stretch to say there is no demand for Treasury debt based on one auction. In fact, last week’s 3, 10, and 30-year bonds all traded through the market yield. The auction stats describe the supply and demand environment at the time of the auction. Many factors affect the auction statistics. However, when fat tails become the norm over extended periods, one can presume demand is weak and or supply is too plentiful.
Tweet of the Day

“Want to have better long-term success in managing your portfolio? Here are our 15-trading rules for managing market risks.”
Related: Is the Magnificent Seven Living in a Bubble? Get Answers from the Nifty Fifty