
Trending

Written by: Michael Landrum | AAM
At the end of the first quarter, we thought the municipal (“muni”) market had mostly avoided the tariff volatility that sent shockwaves through the markets on a widespread scale.
The average 10-year AAA muni bond started the year with a yield of 3.06% and ended the quarter a bit higher, but only slightly, at 3.3%. Munis somewhat followed the prevailing rates environment but in a much more orderly fashion than the rest of the market. Adjustments to the AAA Muni scale came often with headlines moving markets daily, but nothing that really pushed the muni market off balance. Moves usually came 2-4bps (basis points) at a time and the largest single-day move we saw in the first quarter was only 10bps. If you were paying attention to the broader markets, you know that describes an extremely tame environment in municipals compared to other asset classes.
One of the primary metrics we use on the trading desk to gauge the value on different parts of the curve is the ratio of the AAA muni yield to the comparative Treasury yield (TSY). We started the year in a tough spot with relative valuation. Municipals inside 10 years were yielding about 65% of the comparable Treasury, meaning you either needed to be in a very high tax bracket or take on some credit risk to get your money’s worth. The 30-year muni ratio provided a bit more reward for the duration risk, but was still yielding only about 80% of comparable Treasury yields. By the end of the quarter, munis inside of five years had moved up to around 70% of Treasury, the 10-year moved to 77% (10-year TSY rallied start to finish in Q1, while the 10-year muni yield was 30bps higher as mentioned above, thus the better relative value). The long-end ratio jumped all the way up to 92% of Treasury on the 30-year, meaning investors potentially could get almost as much yield as a taxable bond. On the trading desk, we saw this simply as a move toward historical averages and a normalized market. And then came April….
Munis had strong new issuance in the first quarter, but with the additional supply came a strong helping of demand. Historically, outside of the three summer months, January and February are the largest months for reinvestment dollars coming back to the market. Through principal and interest being paid back to investors, munis had $42.9 and $45.4 billion coming back to the market looking for a home in January and February respectively. March was no slouch either at $27.6 billion. 2024 left muni funds and ETFs (exchange-traded funds) flush with cash with most of the year being consecutive weeks of inflows into funds, and Q1 2025 was not much different. The first few weeks of January, and the last few weeks of March, posted fund outflows, but nothing higher than ~$500 million, and the outflows were more than offset by a seven-week stretch of inflows from late January to early March.
By the second week of April, Lipper posted the single largest organic outflow that I have seen since I have been tracking the number (not including the Covid panic which reversed very quickly). $3.3 billion came out of muni funds, and while that may seem digestible for a $4 trillion market, it’s emblematic of the overall direction of cash in the extended market. Money was coming out of muni bonds, and it was coming out in a scale we had not seen for a while.

The volatility really started in the first week of April. On Thursday, April 3, and Friday, April 4, we actually had a rate rally. Munis had 10-12 bumps to the AAA scale each of those days and we thought that we were going into the next week strong. The following Monday, the aftereffects of that $3.3 billion outflow started to take hold and secondary bid-wanted lists spiked. The scale was cut 30-35 bps on Monday, slashed another 20-25 bps on Tuesday and cut another 30-42bps on Wednesday. This was a 0.8%–1% move on yields in the matter of only three days! On Thursday we caught some crossover buyers taking advantage of the volatility, so the scale recovered. We bumped 43-50bps in yield that day, but at the time the bumps felt overdone. Friday made up for it by cutting the scale another 25-27bps.
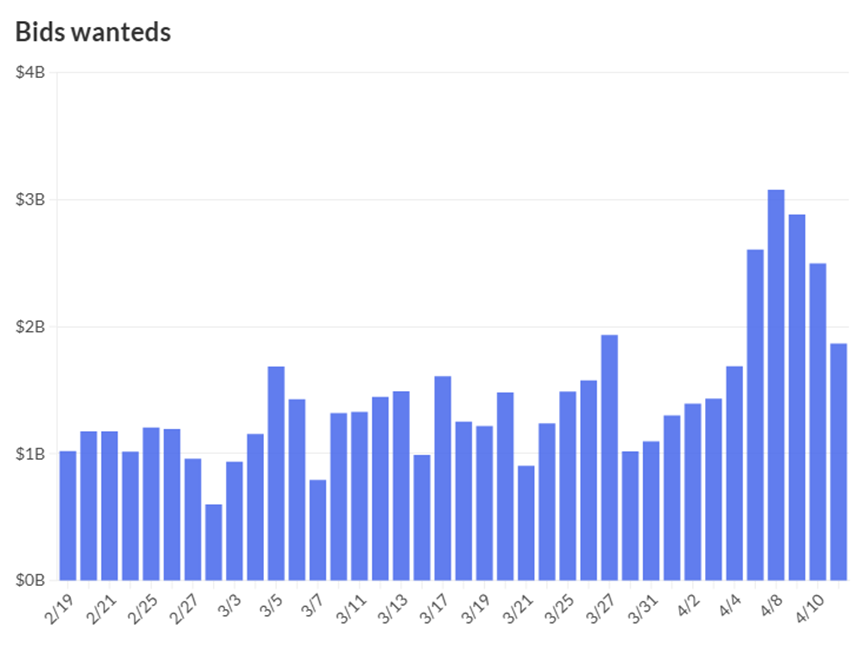
Source: The Bond Buyer
It is important to understand that a typical move in the muni market is usually between 2-5bps and it is a market known for lower levels of volatility. So why did the market move so suddenly? Why was there a delayed reaction to the tariff volatility? Or did volatility just spike on no apparent economic news?
To answer that question, there are a few things to point out:
- I mentioned earlier that principal and interest coming back to the market for reinvestment was a big number for January and February. April, on the other hand, is the lowest number for the year, and less than half of what was being reinvested in Jan/Feb, so there wasn’t near as much cash on the sidelines as the market has been used to.
- There was a major cognitive bias in play and that’s the idea of loss aversion. A loss will take a greater emotional toll on investors than a comparable gain and they will take more risks to avoid a loss. Taxes were due April 15 and there were a lot of portfolios out there that had a lot of losses in other asset classes! Muni returns were mostly flat until April, and they were a prime target for investors needing to raise cash and looking to avoid a loss.
- Finally, the landscape of the municipal marketplace has changed significantly over the past few years.
Electronic and algorithmic trading have become the norm over the old vanguard of a person-to-person phone call and a few calculations on an oversized calculator.
Municipal funds and ETFs have consistently grown, taking larger portions of the municipal market funds under management. When funds need liquidity, they are trading very large positions that will be sold into a market with an average trade size of $229,086. We have operated our financial system with an elevated money supply for many years, so inflows into these funds have consistently outpaced outflows, and there has not been a need for liquidity in scale for quite some time.
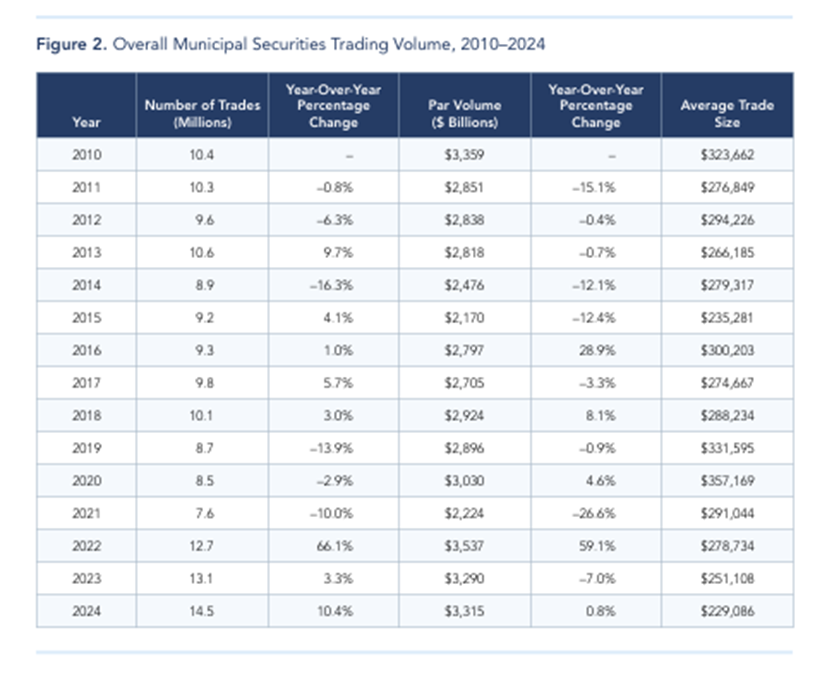
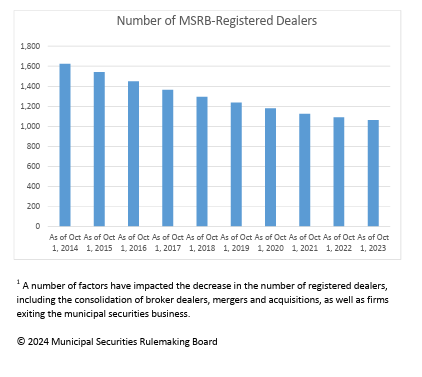
Source: MSRB
Finally, the number of municipal dealers is on a steady decline, including complete exits from the market from notable names. Consolidation of dealers has played a role as well as increased regulatory strain with rule proposals like one-minute reporting requirements to MSRB.
On the trading side, the week of April 7 was extremely interesting to watch the selloff unfold. We logged in each day to some very large liquidation lists and as those items sold, they were at very wide prices to the market the day before. The blocks that were trading dictated prices and prints for the day, almost down to the basis point. On Monday, April 7, there was a very early print on $2.5 million of a bond that was exactly 30bps wide to the previous day’s scale. For that maturity, we closed exactly at a 30bps cut to the market. The rest of the week followed suit, and we saw that process repeated many times over.
There was no major credit event over the weekend and the markets had long since reacted to the tariff news. All it took was investors selling their funds, and the liquidity in the markets broke down rather quickly. Due to the sheer number of issuers and quantity of smaller deals in the market, one of the challenges to municipal investing has always been liquidity. However, as algorithmic trading has increased, liquidity feels much stronger during stable markets, but when volatility increases, the computers notice first and aren’t subject to cognitive biases. Their bids will widen significantly or disappear completely, and as we saw above, the pool of dealers providing liquidity overall has declined.
These markets can be a great teacher, and we believe there are two very important takeaways from this market event:
First, the biggest advantage of a fixed income investment is defined right in the name. We believe a portfolio with a fixed income stream and a fixed maturity date is essential to managing volatility from unexpected sources.
Finally, munis are the cheapest they have been to other asset classes in a long time! We have rallied some as market liquidity recovered, but as of the close on April 23, munis are 79% of Treasuries inside of 10 years, 89% of Treasuries on the 20-year, and 94% of Treasuries on the 30-year. When you consider taxable equivalent yields for a given tax bracket, the income stream derived from the municipal market is hard to pass up, in our opinion.
Related: Brace Yourself: The Real Impact of Tariffs Starts Now