
Trending

It’s a great time to know what you own, starting by better understanding “the market”
This year has been one of the most deceptive on record, because investors are thinking one thing and reality is another. For some, the “market” is the S&P 500. If you own an S&P 500 Index fund, that makes sense. But whether you are part of the masses who do rely on the “headline” S&P 500 Index to grow your wealth, there’s something you should know. Specifically, there’s more to it than meets the eye. For the sake of managing risk if you are in retirement or nearing it, it helps to separate the index you think you know from the one you see when you peel back the onion a few layers.
Since space doesn’t permit me to explain all the different segments, themes, sectors industries and factions within the 500-stock iconic U.S. stock market index that is the S&P, I developed a single snapshot to make the point. That way, if it hits home with you, it can represent an awakening of sorts, just in time to make sure your portfolio and investment strategy is in check for 2022.
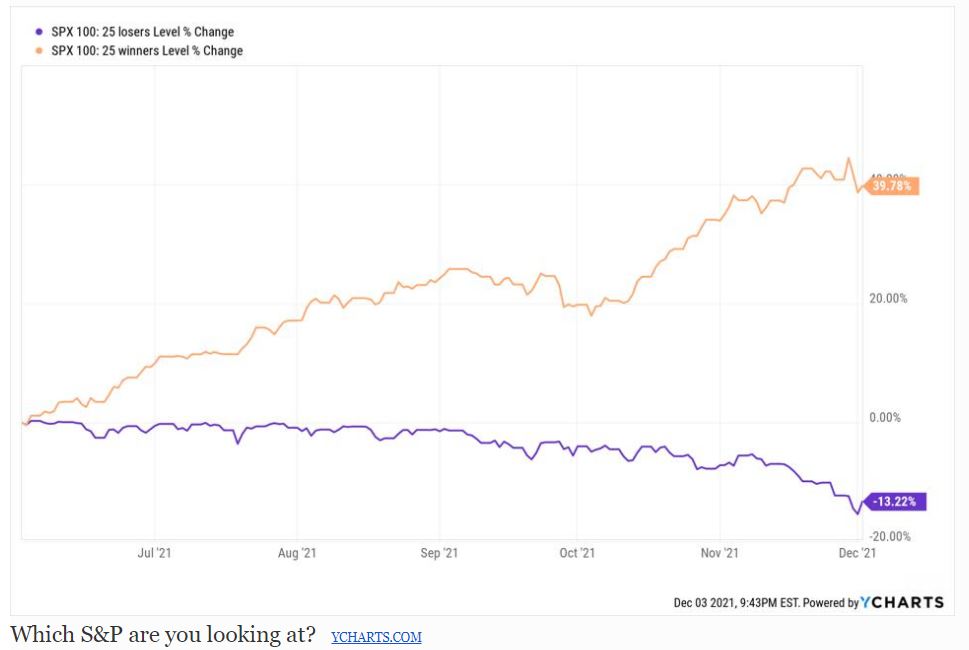
Above you see a pair of hand-picked watchlists I created. Starting with the 100 largest companies in the S&P 500 Index as of December 3, I looked back at what I know has been a period in which divergent performance in the overall stock market has been the norm. I wanted to see if even within that somewhat narrow group of 100 “megacap” stocks, if they were moving in sync or not. Spoiler alert: they are not.
The period covered here is about 7 months, from early May to early December of this year. This was not some random test. It was biased...in a good way, I think. The goal was to show just how different a market it can be, especially now, depending on whether your portfolio is stuffed with the very biggest FAANG-type stocks, or if you are one of the many equity investors that has a diversified basket of what you consider to be “solid businesses.” After all, the 50 stocks chosen from the 100 largest are all substantial businesses. They would not have the high market capitalizations they do if they didn’t...unless they were Enron...but I digress.
If you look at the graph above, you see the cavernous gap between the performance of the average “Winners List” stock and the average “Losers List” stock since early May of this year. How can this be, when the “market” is doing so well this year?
To take it a step further, here is the list of the 25 stocks in each list. While the Winners list has a healthy dose of the biggest tech and consumer favorites (Apple AAPL0.0%, Alphabet/Google, Microsoft MSFT-0.4%, Netflix NFLX-1.7%, Nvidia, Tesla TSLA-3.5%, etc.), the 25 companies on the Losers list are certainly not slouches. But it is the case that you could have owned an equally-weighted portfolio of the 25 stocks on the left, and suffered a 13% loss during the past 7 months. So much for “blue chip” during that period, eh?
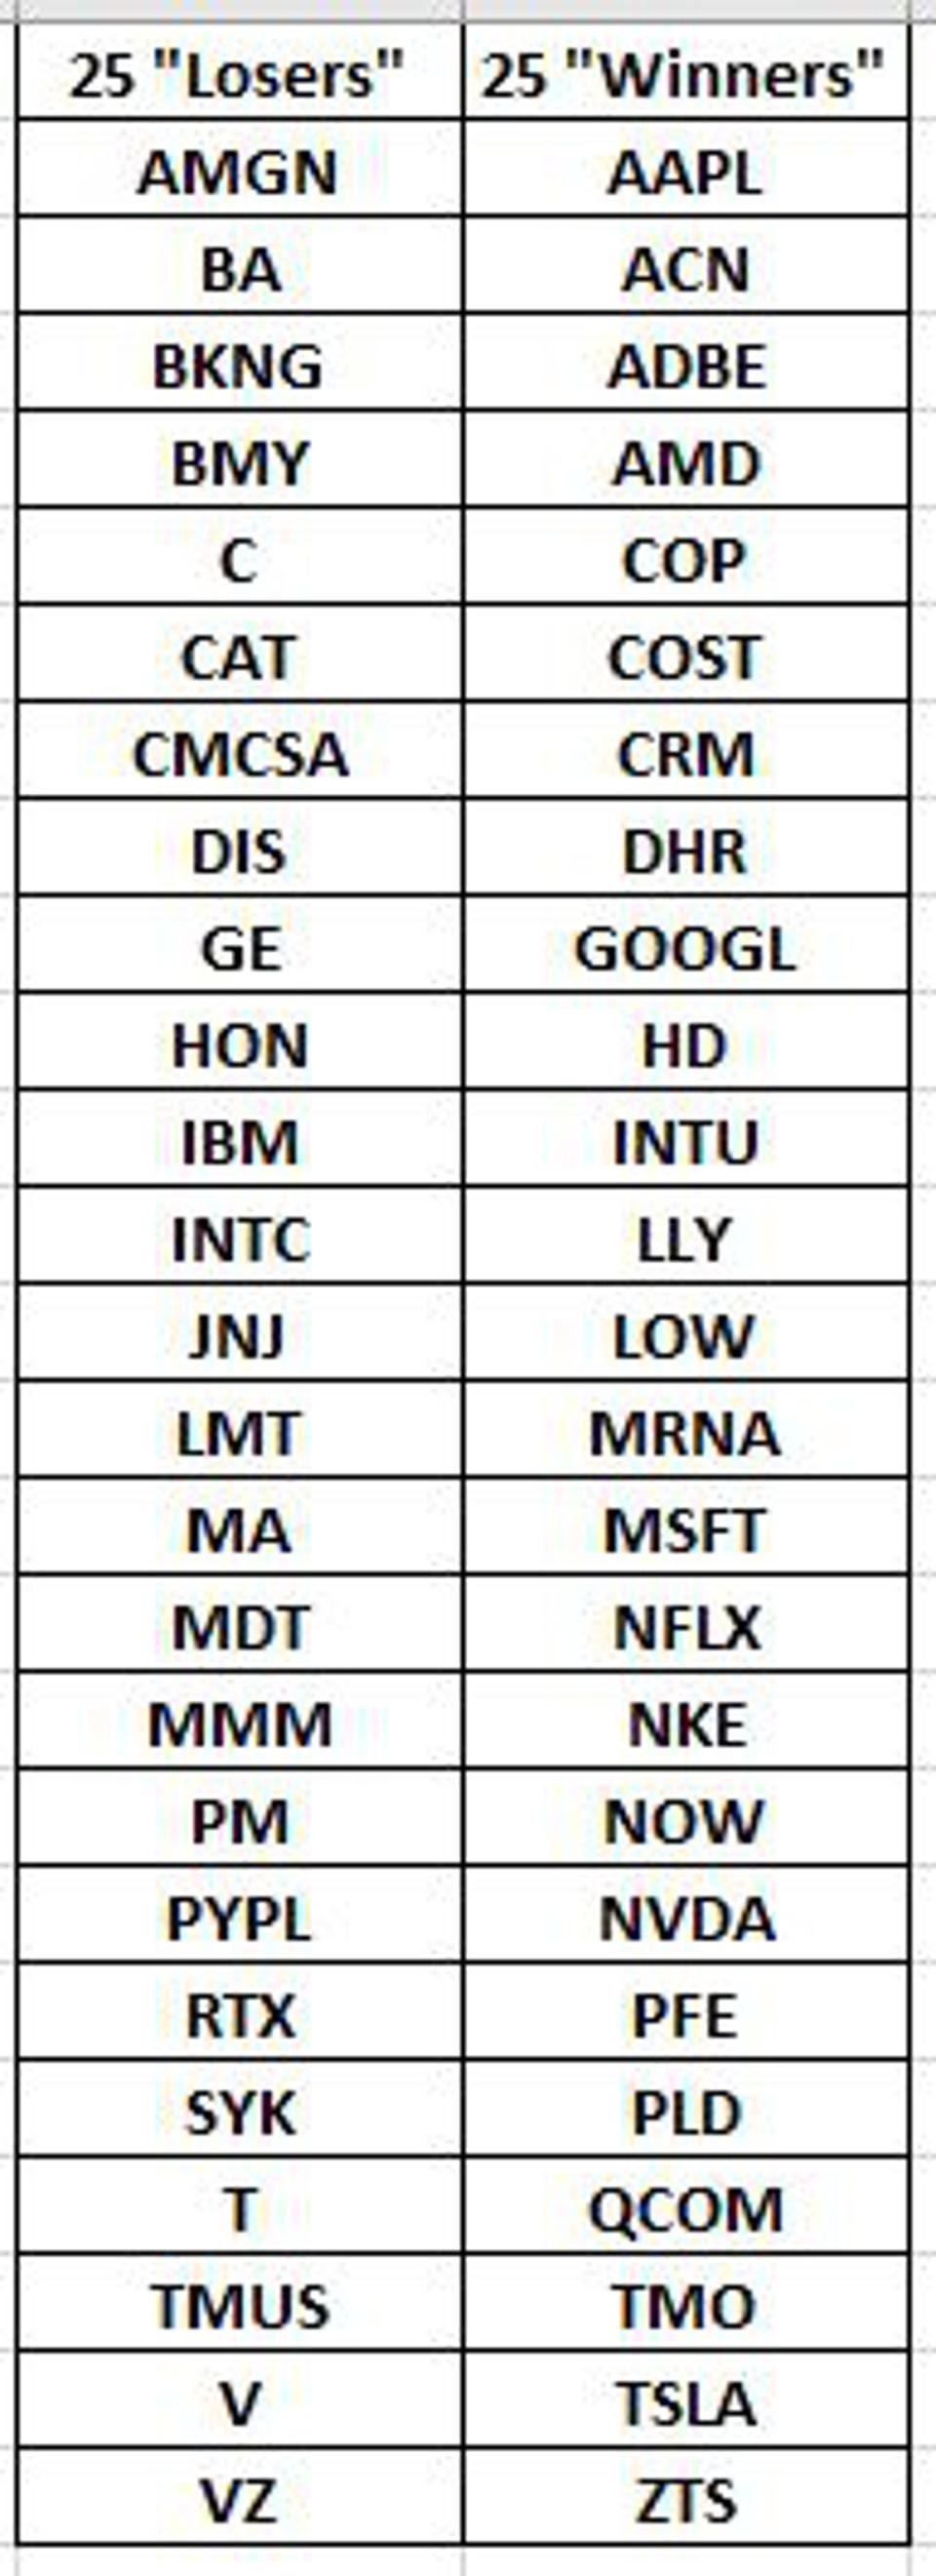
Components of the 2 stock baskets chosen by Rob Isbitts, the author of this article, to demonstrate diverse performance within the 100 largest stocks in the S&P 500 YCHARTS
Takeaways
- The S&P 500 is not what many think it is. It is probably the most misleading stock market indicator of the modern investing era. It was not always the case, but after 12 years of a bull market, with only brief, sharp, breakdowns along the way, the S&P 500 has become so over-concentrated in a small number of stocks, the index’s return can mask cracks below the surface, even right below the surface.
- Whether or not the stock market as a whole is in a “bubble,” the fever-pitch of S&P 500 Index investing IS in a bubble. How long will that good feeling last? No one knows. But as was the case over 20 years ago in the Dot-Com Bubble era, it will continue until it stops. Then, risk will likely happen fast.
- Diversification away from the dominant S&P 500 stocks is not a cure-all. As with the game of chess (which I stink at), once you knock off the king, the game is over. So too could be the case in the future. When the NasdaqNDAQ-0.5%leaders fall and do not simply rebound in a heartbeat’s time as they have for over a decade, there may be an opportunity to profit from the rest of the S&P 500 components, including those on the Losers list above. But do not consider it an either or. It could simply be the leaders signaling that its time to retreat, and the whole army (of stocks) follows the leaders.
- That’s why understanding the limits of the bull market from this point forward are so important for retirees and pre-retirees to understand. Maybe it goes on for years. But are you prepared if it doesn’t? That’s where risk-management in the form of hedging, tactical management (”renting” stock positions for weeks or months rather than “owning” them for years) is worth considering.
Today’s losers can be tomorrow’s winners, and vice-versa. The important thing is to recognize that the S&P 500 Index is more than it appears to be when your phone tells you how it did during that market day. In fact, in many ways, thanks to the distortions caused by a long bull market, the S&P 500 is a lot less than it appears to be.