
Trending

Written by: Matt Lloyd | Advisor Asset Management
Entering the part of the year where lucid and docile moves often elope for a couple of months and leave uncertainty and volatility to have their way. As such, it is always “IFFY” this time of year, but perhaps a bit more exacerbated with the recent history and many historical influences. We will look at some of the IFFY parts of the markets currently:
- International and indexed relative performances
- Fundamentals of the cycle
- Fiscal stimulus and the crossroads we are at currently
- Yields in debt instruments across the globe
We continue to see value in the international markets where they haven’t had as much of a recovery in prices from the pandemic’s impact and the recovery trade. Though we have seen some nice returns in many of these markets, their recovery from the pandemic has been more limited.
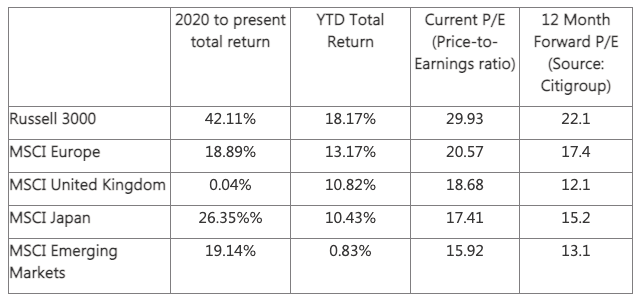
Source: AAM, Bloomberg data | Returns in U.S. dollars; 12-month forecast is for the country not in particular for the index | Past performance is not indicative of future results.
To view this graphically, consider this chart below.
Source: Bloomberg | Past performance is not indicative of future results.
When we look at the earnings expectations and what is fundamentally baked into it, we find some substantial discounts:
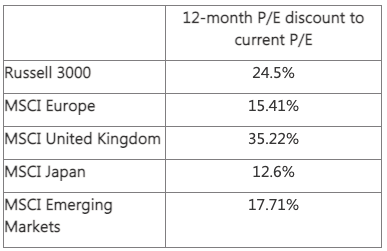
Source: AAM, Bloomberg data | Past performance is not indicative of future results.
The only two regions of the five above that are trading at or below their median 12-month forward P/E (Price-to-Earnings ratio) are emerging markets and the United Kingdom markets. Those are two of the areas we continue to focus on for our international weightings, though we would have exposure to Japan, Europe and the U.S. selectively. In the markets that are more richly priced, we would look to be more selective within the indices for relative potential for outperformance.
The areas we continue to favor are financials, energy, and materials. Segmenting more weighting to these sectors will not impact the indices as they are not as a large of a percentage as they once were, but inside the individual investor’s portfolio, relative better performance is the goal. This points to having active managers in areas where you may have once been indexing. We label the ability to generate alpha in a richly priced market as Darwinistic. Not only have outflows from actively managed funds slowed to the lowest levels in the last seven years, the outperformance through July for active managers relative to benchmarks stood at 48% according to Bank of America Merrill Lynch’s Savita Subramanian.
The fundamentals of the global economy seem to be pointing at early to middle cycle, yet many market metrics are sending confusing messages. So those who have utilized traditional signals for evaluating where to allocate investment dollars may be a bit confused. Case in point, consider the unemployment rate. We currently are at a 5.2% unemployment rate, below the 70-year average. At the same time, we are estimated to have over 10 million job openings at a time when over 7 million citizens receiving unemployment benefits are now expired. Will this naturally fill in the needs of the employer? No, as perfect fits for openings relative to those seeking jobs are more than likely going to require substantial training to new professions. What this points to is higher wage inflation (recall the third phase of inflation we have written about) and ultimately determines the pass through. The pass through of higher costs will determine the Fed’s assumption and hope that current inflation is transitory is valid or not.
With GDP estimates remaining elevated even considering the rise of the delta variant and polarized responses across the globe, the fundamentals are iffy. If one were to create a ledger of early cycle and late cycle metrics, one would be flummoxed at how many are point to late cycle. Taking everything into account, a mid-cycle evaluation with nuanced refinements of how to invest differently at this stage is where we believe is the best strategic starting point.
The recent wild card that has created a wave of doubt is the potential passage of the Reconciliation Bill. It currently stands at $3.5 trillion and has been mostly accepted it would be passed around this level. However, when the political favorability winds blow against a certain party, a need for renegotiating suddenly become necessary. Dan Clifton of Strategus has done a tremendous job of following this corn maze. Roughly 36% is broadly attributed to safety net, 24% to health care, 15% to education and the rest nearly equally split between energy and housing. The bulk of the spending was to be offset by increased taxes on individuals and corporations. Strategas estimates about a trillion in spending offset to come from increased taxes to individuals and almost the same amount on corporations. It is important to note that this is not an annual expenditure number or how taxes will offset it in the year. Rather it is projected over several years. While the tax rate for corporations would be the third highest in the world if President Biden’s plan were to go through, expect many new maneuvers and the bill for tax attorneys to be the biggest part of wage inflation moving forward. We would expect the effective rate to be at a substantial discount to the rate advertised.
As it pertains to earnings, most are expecting about a 5-7% hit to earnings per share should the plan go through. This only amplifies the “iffiness” of the markets currently. As we expect a bit of negotiation to go through before passing, this may be hanging on the markets until it becomes clearer, but it will ultimately have its say on the market’s direction, if at least for a short time.
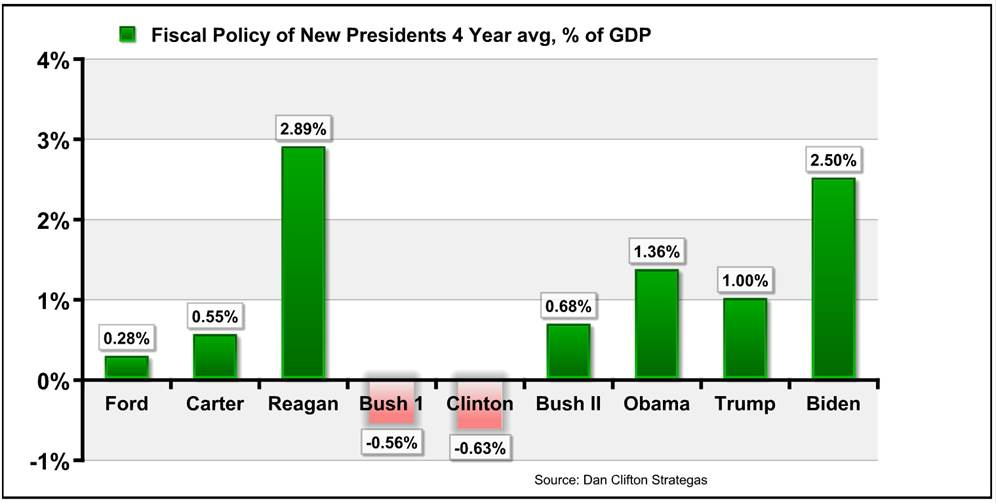
One point Dan Clifton of Strategas brought up is the amount of fiscal policy for each U.S. president annually administered as a percent of GDP and how it looks compared to past presidents.
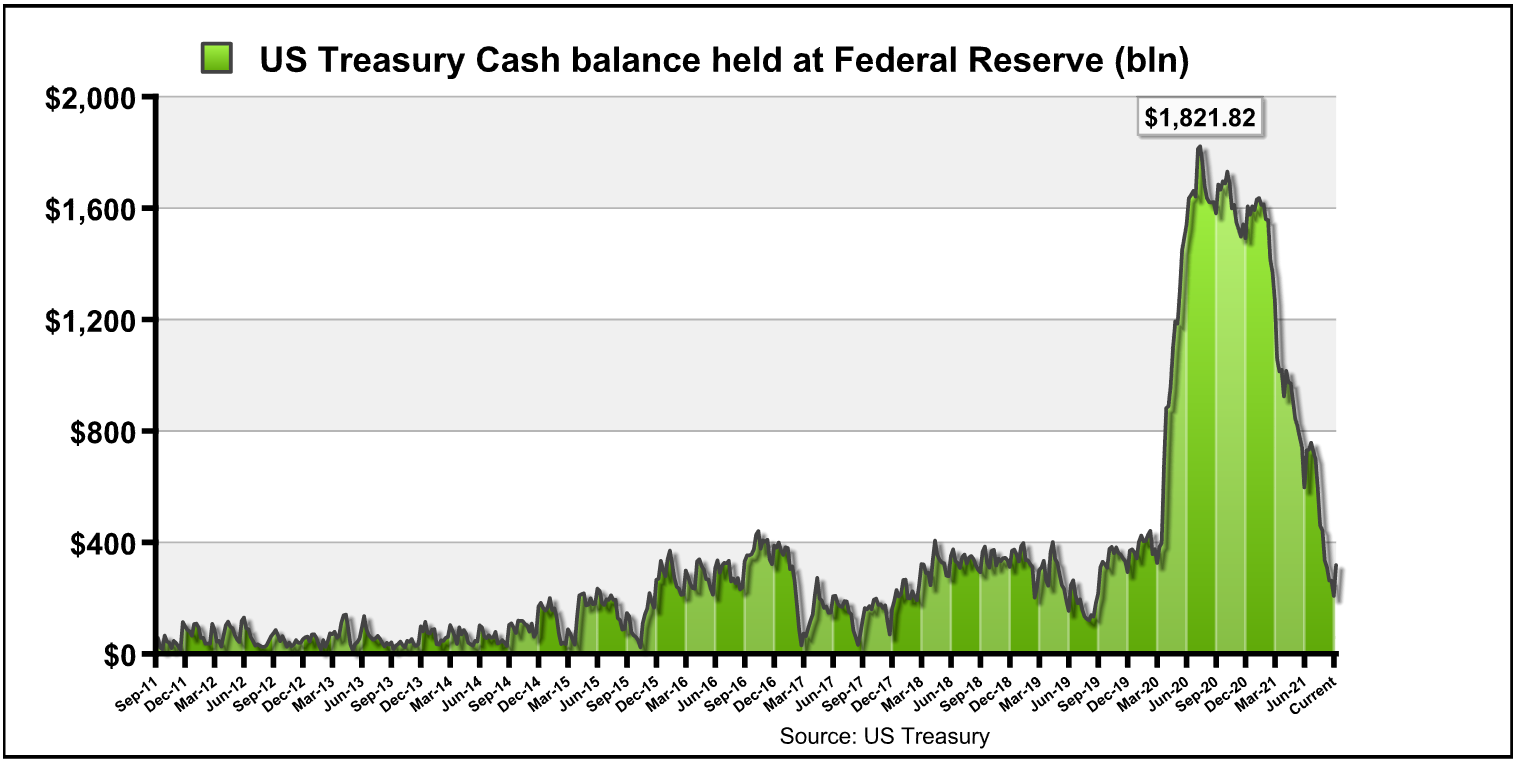
While we expect a passage of the spending bill to ultimately come, it may look quite different than what was previously expected. The budget will have to be done by the end of September based on the fiscal calendar of the Federal Government going from October 1 through September 30. If it’s not approved by then, certain government activities will need to be suspended. The debt ceiling is fast approaching and will begin to draw criticisms from both sides of the aisle. It was estimated the government would run out of cash around September 30, but currently they hold $317 billion at the Federal Reserve. However, the drain on this has been substantial after the coffers were as flush as seen in history just a year ago. This rhetoric over the next few weeks will be elevated, so you may want to charge your noise-canceling headphones.
Lastly, we won’t belabor the interest rates and yields in general as our team here has written extensively about the risks for investors. The “8th wonder of the world” surely must be negative-yielding debt and the lack of how abnormal this is in a normal market or economic time. Though in time there has been negative rates, they were brief…even in the U.S. when World War II had a risk-off approach and Treasury bills had a negative rate for a brief point in time. However, due to the contagion of Quantitative Easing, we have been accustomed to it since it first popped up in significance in 2009. We currently stand at $14.19 trillion in negative-yielding debt across the globe. Though well off the highs of $18+ trillion in December 2020, it is still elevated and has an anchoring impact on all yields. This should be monitored more closely over the next few months as we see if the recovery trade and growth pick up in Europe and Japan, and if it begins to move back down below $10 trillion. Should the delta variant prove more cumbersome, a new high may be set and spark a new risk-off approach for yield investors.
In an “iffy” market, there is not a good binary solution; however, utilize multiple dimmer switches across the globe and be cognizant of the potential for pullbacks and correlation. We believe utilizing active professional management in those areas where one once would lean toward passive as relative performance inside indices and portfolios is going to be the focal point.
Related: The “Inconceivable” Market Moment