
Trending

Written by: Meera Pandit
Since emerging from the Financial Crisis, a 60/40 portfolio of U.S. stocks and bonds has earned a whopping 11.5% average annual return. However, 2022 has been a particularly challenging year for the 60/40, which declined 16.1% in the first half of the year. This has prompted the question—is the 60/40 dead?
Although returns this year have been unsettling to say the least, a double-digit decline in the 60/40 portfolio is not unheard of. Since 1980, there have been nine instances in which the 60/40 fell more than 10% within a given year. Yet, investors who were patient with their portfolios were often rewarded with a rebound. In five of those years, returns still ended the year positive. In eight of the nine instances, returns the following calendar year were positive, with an average return of over 17%.
While it has been a painful ride down, the reset in valuations creates opportunity for subsequent returns. If we look at a valuation measure of the 60/40 based on blending the earnings yield (inverse of P/E ratio) on stocks and the yield-to-worst on bonds (higher = less expensive), valuations have cheapened from 3.5% to start the year to 5.3% at the end Q2. These lower starting valuations imply an average annualized return over the next decade of 6.1% compared to just 2.6% to start the year.
The near-term environment for stocks and bonds could continue to be challenging with the Fed aggressively raising rates to tame inflation. However, it is likely that most if not all of the Fed rate hiking cycle will be behind us by the end of the year. Bonds have struggled while rates have risen, but as investor concerns shift to slowing growth, there is scope for yields to fall. Stocks may face additional headwinds as earnings expectations are revised down, but significant repricing has already occurred. Therefore, it is important for investors to focus not on where returns have been, but instead where they could be going in the months and years ahead.
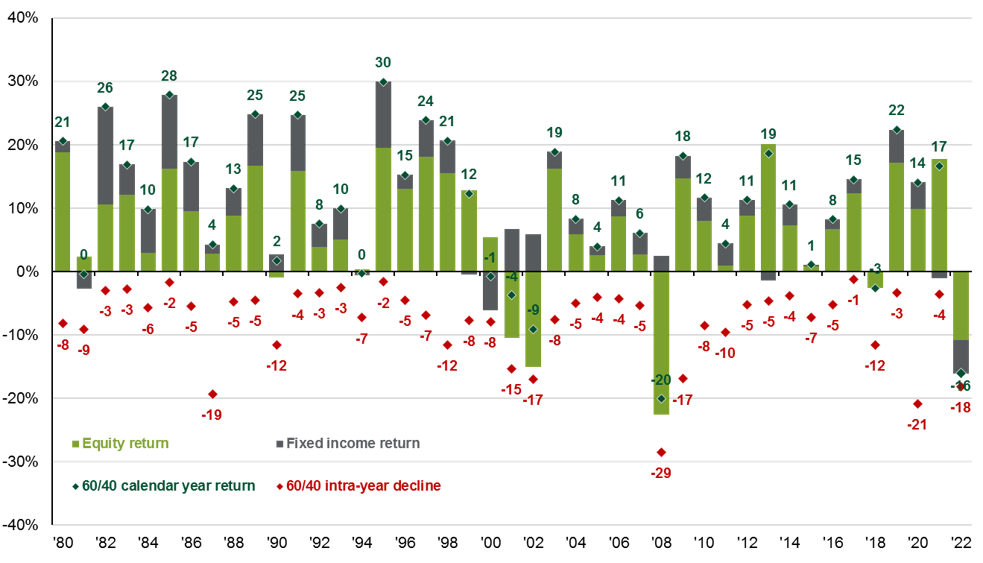
60/40 portfolio intra-year declines vs. calendar year returns
60/40 Portfolio: Despite average intra-year drops of -7.7%, annual returns were positive in 35 of 42 years
Related: Is There a Role for Private Real Estate in My Portfolio?
Source: FactSet, Standard & Poor’s, Bloomberg, J.P. Morgan Asset Management. Intra-year drops refers to the largest market drops from a peak to a trough during the year. For illustrative purposes only. The 60/40 portfolio is 60% invested in S&P 500 Total Return Index and 40% invested in Bloomberg U.S. Aggregate Total Return Index. The portfolio is rebalanced annually. Returns shown are calendar year returns from 1980 to 2021, over which time period the average annual return was 10.6%. Guide to the Markets – U.S. Data are as of June 30, 2022.