
Trending

Written by: Matt Lloyd | Advisor Asset Management
When putting a puzzle together, one must have a reference to begin placing the pieces together. The same methodology works in the markets and economy. However, what does one do when the picture or the pieces morph into something slightly different, or perhaps drastically different? Confusion arises from the cacophony of the multiple forces that have various levels of influence. There are, however, several key inflection points that historically are material to the direction of the economy and markets. We recently hit one of the inflections points that investors in every asset or debt class need to pay close attention this last week with the Federal Reserve raising rates after being in multiple easing accommodations. While this has been expected for some time, it now forces many to shift from the micro movements to the macro forces. Perhaps the dressing for weather and the climate has never been more important and never been more confusing.
Ultimately, context of these events can increase the misreading of these events but is an exercise that must be done to arrive at better probability of how these events unfurl and ultimately end. The good and the bad is succinctly summed up by Voltaire: “History does not repeat itself, but mankind does.” So, while we explore the history of these inflection points, we also need to take a nuanced behavioral view to how things are different and what is the most expected conclusion.
When the Fed raises rates, it sparks a shift in economic and market moves. The first is the shift from the Fed in their expectations…which is wrought with changes from meeting to meeting. The chart below compares three months ago (gray line) compared to the current expectation (green line) of the trajectory from the Federal Reserve about the Federal Funds rate.
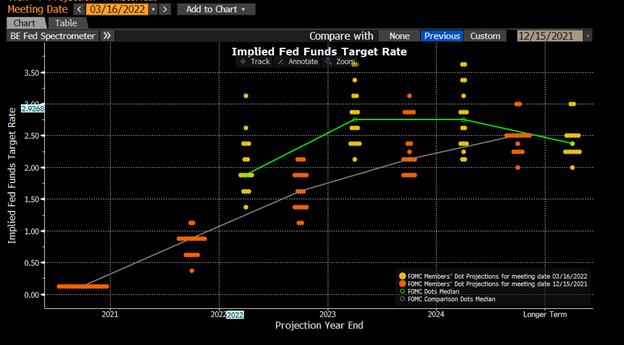
Source: Bloomberg
While they are now elevating the trajectory of rates, there was a drastic shift in what the 2024 year looks like with a potential cut in rates. The last rate at which the Federal Reserve acts either ends in a recession (most often) or declining economic pressures, and growth is referred to as the terminal rate. Wall Street is nothing if not dramatic in their connotations, see the “Hindenburg indicator” or “Death Cross” as other examples. When calculating the terminal rate, many utilize the Fed Fund Futures and euro-dollar optionality to calculate what this rate may look like. Estimates for this have been somewhat range bound with anywhere from 1.75% to 2.25% being the common range.
It appears to us that the yield curve shape is affirming this range and arguably possibly closer to 1.75%. Compare the various maturity benchmarks and their corresponding spread between a counterpart on the curve to get just how flat the curve is (denoted in red box) and what we look at more closely with the spread of the 30-year Treasury and the 5-year Treasury at the bottom. This is a three month to compare how the market has responded since the dot plot above and the last Fed meeting for proper context.
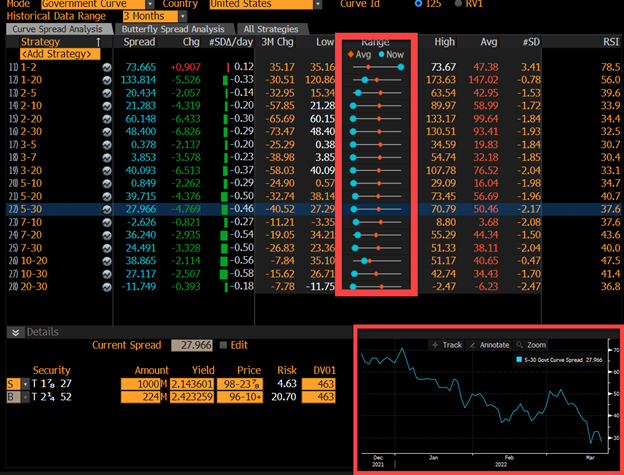
Source: Bloomberg
For a graphical representation, the chart below is the yield curve in its totality. The 20-year Treasury has not been historically represented but added for how the on-the-run versus off-the-run yields may shift.
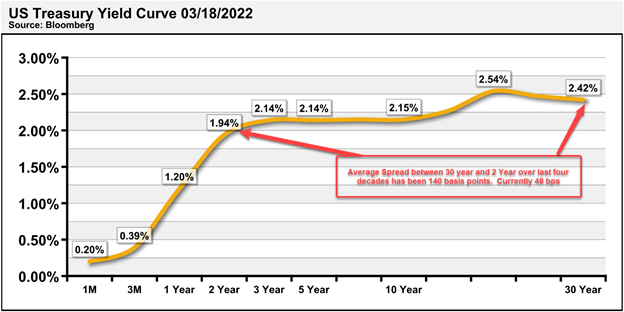
Source: Bloomberg | BPS = basis points
Now, why does the yield curve — which represents investors and speculators targeting their wanted rates of return based on maturity — differ from the Federal Reserve who arguably “controls” rates? While there are many reasons, the market typically is far more accurate and is more proactive while the Federal Reserve must be somewhat reactionary to make sure trends are in place prior to taking any type of action outside of an emergency condition.
So, what is the track record of the flattening curve and recessions when the 30-year and 3-year Treasuries have flattened to current levels? The answer is 60% (denoted by successful signals in white arrow and false signals in yellow circles).
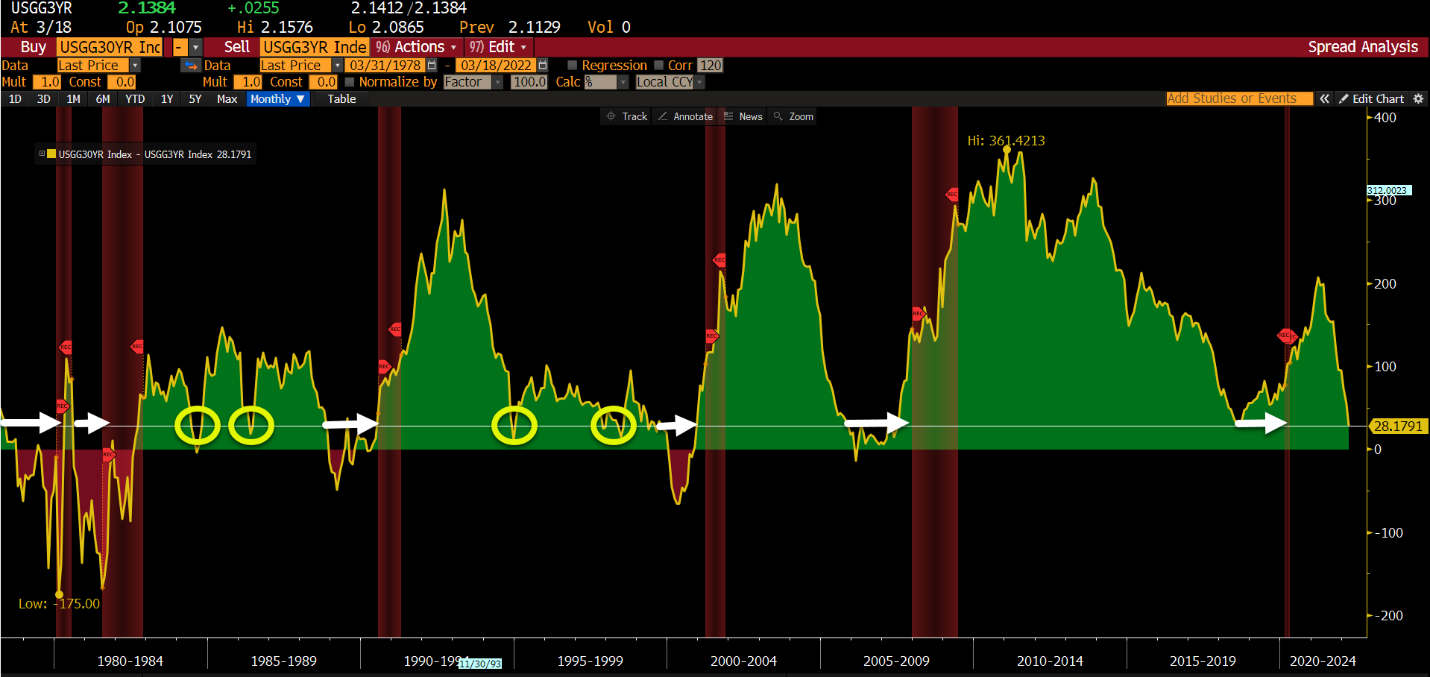
Source: Bloomberg
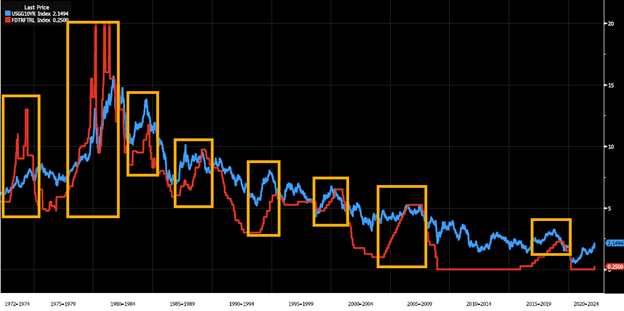
What is often lost is the confirmation that the Treasury curve is nine months or greater ahead of the Federal Reserve and the economy. Historically, we have seen the 10-year Treasury being elevated well before the Fed begins to raise rates and rises a fraction of the Fed’s moves as it already has been pricing in an ultimate terminal rate. While this has been more accurate since early 1980s when the great bond bull market began, looking at the 1972–1982 timeframe gives some anomalies that we need to take into consideration. Will the Chairman Powell react just as Chairman Volker did in the 1970s and move the Fed Funds rate well above the 10-year Treasury to tackle inflation?
Source: Bloomberg
To distinguish between these periods, the long term shows the 10-year Treasury above the Fed Funds rate by an average of 114 bps (basis points) and is currently 165 bps. During the 1972–1983 period, the 10-year Treasury was below the Fed Funds rate by an average of 8 bps.
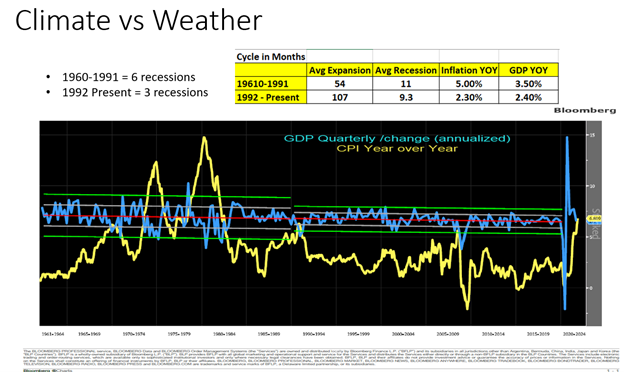
So, while one may discard the 1970–1983 period as an anomaly, we must take it into consideration when we use the framework for what our current conditions look like and what the last 60 years has shown us. In an elevated inflationary environment that is not transitory, the viewpoint of the market and economic cycle should be drastically adjusted. Understanding the climate and the weather is essential in our opinion.

Source: Bloomberg
To distinguish between these periods, the long term shows the 10-year Treasury above the Fed Funds rate by an average of 114 bps (basis points) and is currently 165 bps. During the 1972–1983 period, the 10-year Treasury was below the Fed Funds rate by an average of 8 bps.
So, while one may discard the 1970–1983 period as an anomaly, we must take it into consideration when we use the framework for what our current conditions look like and what the last 60 years has shown us. In an elevated inflationary environment that is not transitory, the viewpoint of the market and economic cycle should be drastically adjusted. Understanding the climate and the weather is essential in our opinion.
Source: AAM
When we take all of these historical components into the equation, we perhaps are going to see a more rate-sensitive economy than many have expected. And this may be more on the consumer side relative to the corporate side from a debt component. Most of the corporate high yield debt has been refinanced or taken out of higher interest-bearing debt and shifted down the curve. This assists in the possible mitigation of a credit crisis when the next recession occurs, and we believe will offer advantages to the professional manager with experience in utilizing their credit work and cash flow analysis to their investors benefit.
Households currently have an abundance of cash relative to history, yet their sentiment is very suspect as we look at the University of Michigan Consumer Sentiment levels. While Households and nonprofits are sitting on a $150 trillion net worth (Fed Flow of Funds) and over $18 trillion in total cash equivalents, inflation is eroding their new high-water mark for liquidity and wages — which are not keeping up with increased prices — and has elevated anxiety by sinking to historically pending recession levels.
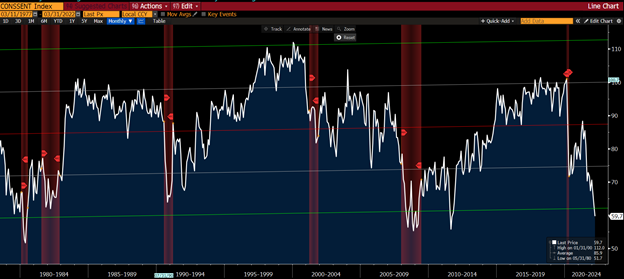
Source: Bloomberg, University of Michigan Red bars denote recessions
The puzzle pieces have morphed dramatically over the last 15 years as globalization topped out, Geopolitical tension has increased and become more complex in its understanding and impacts on markets and the understanding that symbiotic nature of the markets has increased to understand how little macro impacts have been understood or regarded at all.
The base assumption is not so based in history as it must be nuanced with what areas are a bit different this time. There are reasonable arguments that the market rates may not be able to go much higher from here and those that expect it to go much higher. Arguments that we may not be able to get four rate hikes in before the market rolls over can be very relevant just as those that believe for the first time the Fed may be able to navigate the elevated inflation levels with a Fed Funds rate that may be able to go as high as nine times. If you were to take a pragmatic approach and split the difference, history says the markets are already close to pricing in what the Fed may be able to achieve in this cycle. The error in being wrong, however, is some large price displacement which tells us to take a pragmatic approach and maintain a portfolio for multiple contingencies at this point. This is for every asset class and every distinction within each of those areas.