
Trending

Written by: Meera Pandit and Scott Blasdell
Market moves this year have been defined by swings between policy optimism and policy uncertainty. This pattern may persist throughout the year, so investors are seeking strategies to “policy-proof” portfolios. While no corner of the market is immune to these risks, value has outperformed when investors needed it the most this year, with many characteristics that both insulate from and capitalize on policy changes.
- Tariffs – Recent announcements have brought our estimated average tariff rate on U.S. imports to 13.3%, down from north of 20% but still much higher than 2.3% in 2024. Investors cannot rule out tariffs as a source of future volatility or profit erosion, but some areas are less exposed. For example, financials are more service oriented and utilities are more domestically oriented. In addition, defensive sectors like staples and utilities have protected during recent volatility, while real estate has cushioned total returns with attractive dividends.
- Reindustrialization – Although mass repatriation of supply chains is unlikely, the reindustrialization witnessed on the margin over the past few years could have some runway due to tariffs, favoring sectors like industrials and eventually materials. The intersection of reindustrialization and limited immigration gives rise to opportunities in industries like factory automation, for instance. The combination of reindustrialization and tariffs could give domestic manufacturers of materials used to make cement and concrete, for example, a competitive edge.
- Deregulation – Treasury Secretary Bessent has highlighted the administration’s three economic priorities: tariffs, taxes and deregulation. Deregulation has not materialized yet, and early indications of an antitrust détente in tech look bleak. However, financials are poised to benefit from a reduction in financial crisis-era rules and a defanging of Basel III, which could ease compliance costs and boost lending, IPOs and M&A.
Although the spread between value and growth has narrowed recently, value stocks have been an important diversifier in portfolios this year. The chart below looks at the spread between year-to-date value and growth performance plotted against the VIX. Value’s outperformance has been the strongest when volatility has surged; when the VIX peaked at 52 on April 8, value was outperforming growth by 10.3%-points YTD. Since then, the broad market has staged a mighty comeback, but valuations have been boosted too. Despite this, value is still trading at a slightly deeper discount relative to growth than it has in the past.
While growth stole the limelight over the past two years, market moves this year remind investors how having diversified equity exposure can strengthen a portfolio amidst dynamic market conditions.
Value outperformed growth the most when volatility surged this year
Spread between value and growth YTD performance (%) vs. VIX
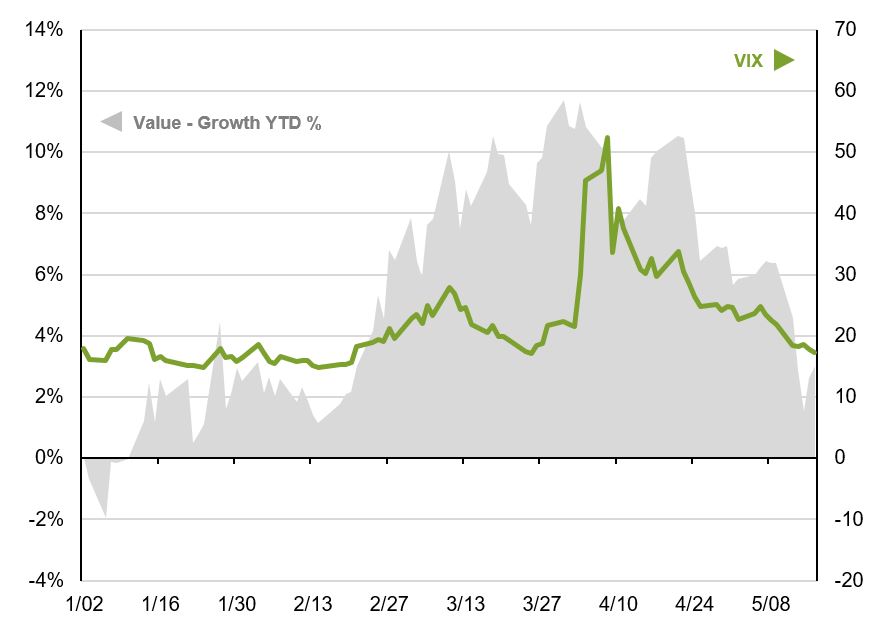
Source: CBOE, Russell, J.P. Morgan Asset Management. The spread between value and growth is the cumulative YTD performance of the Russell 1000 value minus the cumulative YTD performance of the Russell 1000 growth. Data are as of May 19, 2025.
Related: Why Are Currencies Moving? The Hidden Forces Shaping Global Exchange Rates