
Trending

The Calmar Ratio tells you what you really want to know
You have probably not heard of Terry W. Young. And you likely have not heard of the Calmar Ratio, which he invented nearly 30 years ago. But when I tell you what it measures in an investment’s past performance you might remember it for a long time.
The Calmar Ratio takes the average annual return of an investment over the past 36 months, and divides it by the maximum loss (”drawdown”) that investment has experienced during that 3-year period. That original formula has been adapted to different time periods over the years, but the concept is the same.
Pretty simple. And a VERY powerful analytical tool for hedged investors. The higher the Calmar Ratio, the better the past “reward-to-risk” tradeoff that security or index has exhibited.
Why is this so important?
Any investment can achieve very high returns over a few years’ time. In fact, one of the basic assumptions of our own investment rating system is that any investment has the potential to produce positive returns over any time period. What separates the wheat from the chaff, so to speak, is how much risk is attached to that potential return.
Of course, when we are making investment decisions, we are trying to look forward. After all, the one thing we can guarantee about past performance is that we can’t have it. Its in the past, after all.
However, since we can’t predict the future, and we are concerned with avoiding big losses on the way to long-term success, it helps to have something that looks at the past that way.
The Calmar Ratio in action
Here is a quick look at Calmar Ratio, to help us make some assessments of today’s market environment. This chart shows the 5-year “rolling” Calmar Ratio for 4 different stock indexes over the past 10 years: S&P 500, Nasdaq NDAQ +0.6% Composite, Russell 2000 (Small Cap Index) and the MSCI Emerging Markets Index.
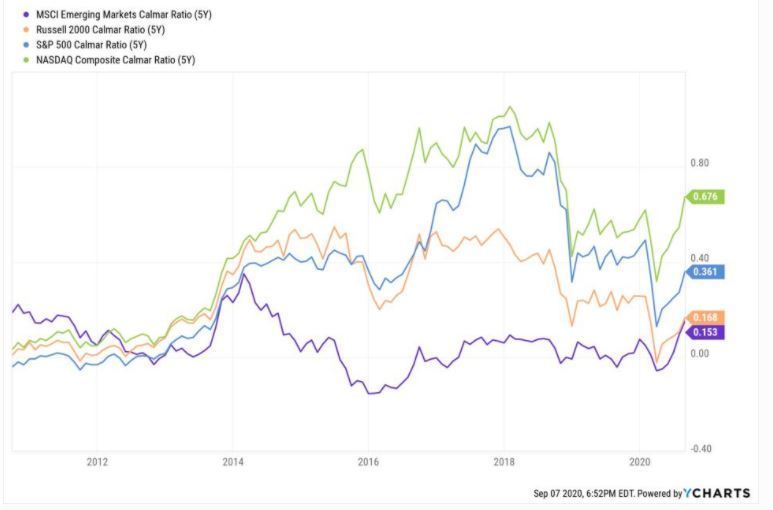
As you can see, the clear winner throughout the past decade was the Nasdaq. Its Calmar Ratio was nearly double that of the S&P 500, and more than 4 times higher than small caps or emerging market stocks.
Think about that for a minute: these are all stock market indexes. And the Nasdaq is supposed to be one of the “risky” ones. But for the past 10 years, it has consistently been worth whatever major declines might occur along the way. That’s what the Calmar Ratio is telling us.
If only it were that easy
We could stop right there, let the “recency effect” blind us to the realities of investing, and call it a day. Or a decade. However, if we turn back the clock and look at the 10 years prior to the last 10, we see something different in terms of Calmar Ratios.
The Nasdaq, S&P 500 and Russell are all quite low on this scale. This indicates that your upside during this period was quite poor compared to how much you would have lost when the wind was against you, so to speak. The Emerging Markets index was a step above, so risk was better-rewarded there. But these are still pretty low Calmar Ratios.
Conclusions for hedged investors
These are just snapshot, but you can be confident this is not the last you have heard from TheHedgedInvestor.com when it comes to using the Calmar Ratio to evaluate investment markets. After all, the Nasdaq and S&P 500 are near all-time highs, and interest rates are near zero. So, the times demand that you put a premium on managing a portfolio that can help avoid big losses (ABL, as we say here), while still providing enough potential upside to meet your objectives.