
Trending

Holiday shoppers are not the only ones with tough decisions this gifting season
It is one of those times
Our goal is always to hear what the markets are telling us, and determine what to do about it. I’ve been doing that since I was a geeky teen in suburban New Jersey in the 1980s. Now, on the other side of a 27-year career as a personal investment manager for private clients, I’m still doing what I did back then. What has changed are the tools, the market participants and, yes, how the markets work.
So in the research/publishing phase of my post-advisory era (we sold the practice in 2020), it is moments like right now that create ideal “teachable” moments for me to deliver to a wider, more self-directed investor audience. Because the stock AND bond markets are about to tell us something very loudly. We just don’t know precisely what that is yet. But I think we’ll know very soon.
Friday (tomorrow) morning’s jobs report might be a moment of decision. Or it could be next Wednesday’s Fed rate decision, the last one of 2023. Or it could be something on our MOFO list of market-influencing factors which the markets finally take more seriously than they have most of this year.
No one knows. However, as always, we can make a strong effort to assess where things are, so that if trends change quickly, we are not stuck wondering why. For that, here are the charts.
S&P 500 (SPY): say something already!
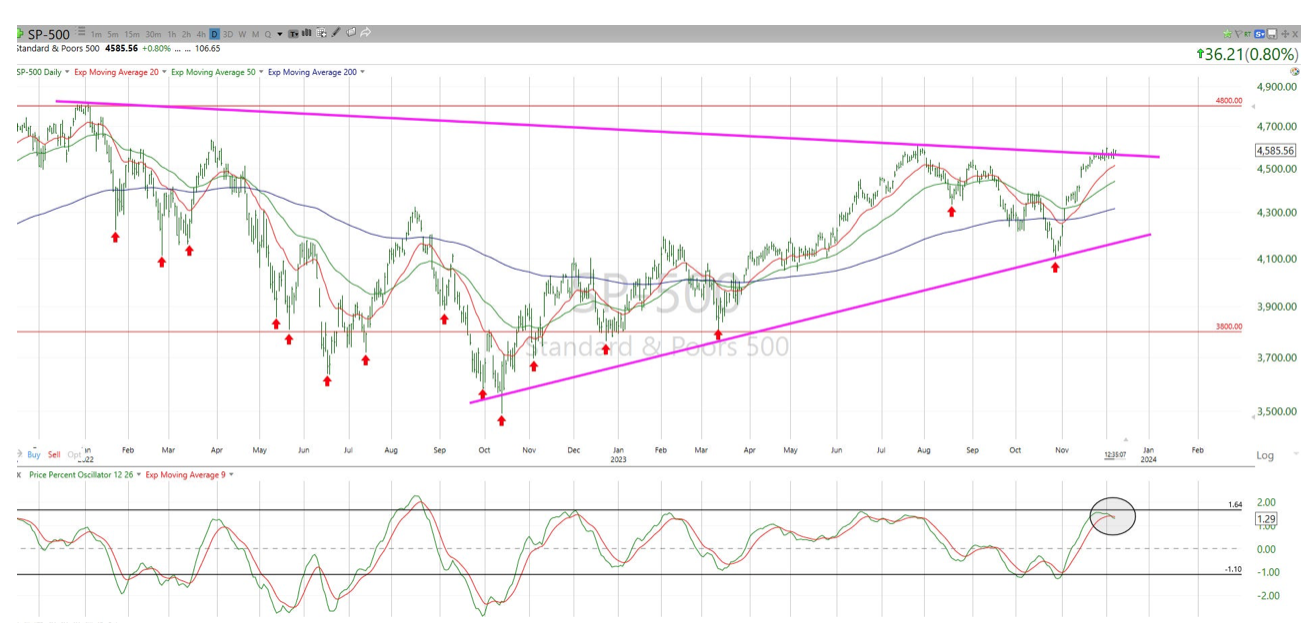
Others see a rally and a new bull market emerging. I say, “where do you see that?” Those purple lines above show that since January of 2022, nearly 2 years ago, there has been a lot of room for the SPY to run around, but it has not escaped the major trend that is that top purple line. Since that time, we’ve had more than a dozen “fakeout breakouts” which I’ve marked with red arrows, the latest of which is a more than 10% up move since October 27. But all that did was bring us back to late July levels around 4,600. That’s the line in the sand. And as you can see, the path to get there was furious. But for the past 3 weeks? Nothing but stagnation.
Adding to the intrigue is the indicator on the lower part of the chart, which is hinting that S&P 500/SPY has used up its energy to get this far, and now either hangs out here longer to reset, or rolls right over and takes the “rally” out of “Santa Claus rally.” Or, more properly, provides market gurus with the excuse that “the SC rally was moved forward in time, so it all makes sense.” Whatever.
Show me a vigorous move through 4,600 that lasts for more than a moment and doesn’t smell like panicked hedge fund managers making up for lost time and opportunity this year, and I’ll look toward where to capitalize on the upside. Show me a dive under 4,400 and we’re looking at 4,100 as a test to see if things don’t simply collapse into early 2024. Those are the “risk ranges,” if you will, as I see them. No rush, let the market tell us before making bold portfolio adjustments.
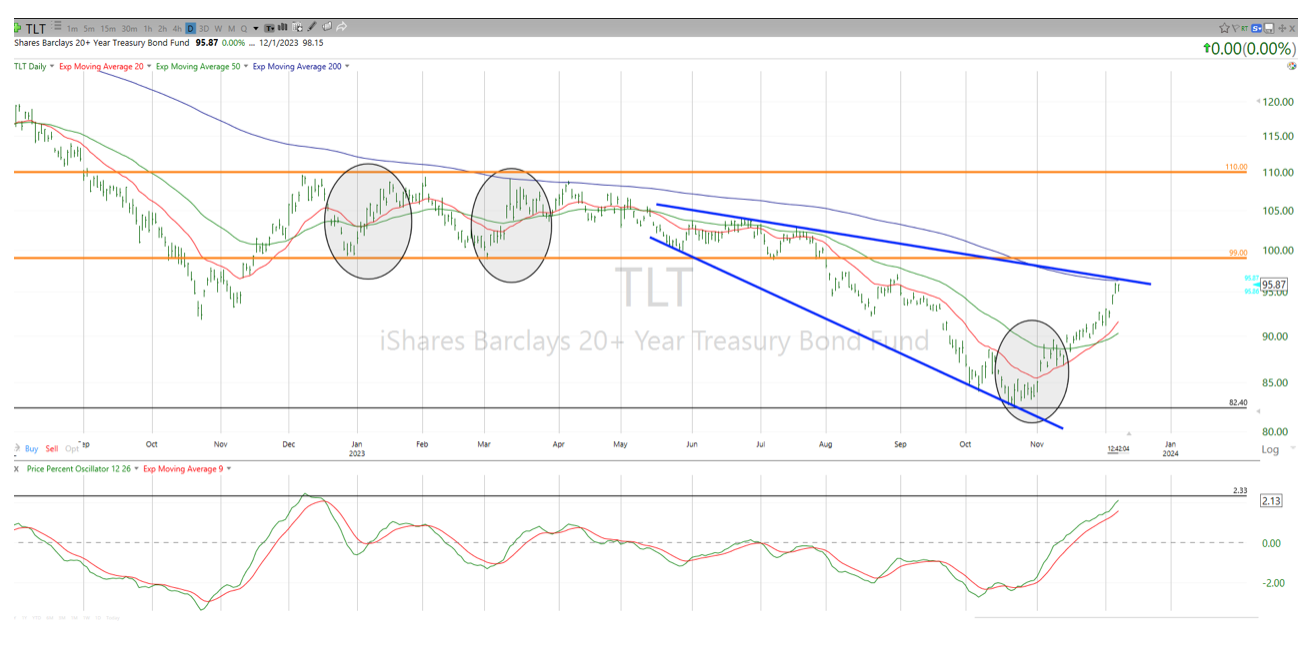
Long-term US Treasury Bonds (TLT): your move!
It has been a “moving” event for TLT as well. And this chart is slightly more complicated, but here’s the bottom line. Those blue lines show that a 15% rally in TLT the past 6 weeks was the “easy part.” I don’t mean easy as a decision, but easy to see in the chart. Since the second quarter of this year, it has been in a declining pattern. I recently did a quick review of TLT’s rallies over the past 13 months. Yes, there have been rallies! This didn’t just start.
We’ve seen up moves of 17.6%, 9.1%, 7.6% and 10.2% over that time, as well as the most recent 15% surge. Each of those times, between 3 and 7 weeks later, most of that rally was reversed in full or more than in full, with lower-lows continuing, as they have since TLT’s price top more than 3 years ago.
So, maybe this is the one that doesn’t fail. If so, that could mean recession fears are spiking. Remember, the Fed lowering rates (as Wall Streeters seem to believe is coming soon) is more likely a reaction to a sliding economy, not a signal that we’ve emerged from a long period of suppressed interest rates and the coast is clear. That’s one of several possibilities, but one that seems to have created a panic-buying frenzy here.
Again, I’m evaluating the reward and risk at all times. The balance here is a big fat “let’s see what happens around this level.” The blue line tells us that this is the time for TLT to prove it is more than just bouncing again. If it clears that test, the orange lines are the next trading range, followed by the purple line (downtrend) and the black line. Why am I not in a rush to pile into long term bonds right now like some sale of the century? Because a $13 move off of the recent low still leaves $30 to $85 per share of upside potential.
To be clear, in my own trading accounts, I am regularly putting positions on and taking them off with SPY and TLT, using options or ETFs or both. That’s trading, fast and loose, as I see fit for myself. It helps me understand how these things are really moving.
What we offer in the premium service is taking the intermediate-term measure of these and 180 other ETFs and wrapping a portfolio management and risk management process around it. This is something I fear is a foreign concept to many self-directed investors as well as professional wealth managers. So I provide the opportunity to read my mind…by simply telling you what I’m doing and thinking in a pair of my own accounts that are a more significant part of my total portfolio than the trading stuff.
The markets are acting like they are waiting for a very important event to occur. In the meantime, they are stagnating at significant price levels, and we don’t know which one or more events will be the one that prompts an “actionable” move in one direction or the other. Also, that both the S&P 500 and long-term US Treasury bond indexes are each at their own unique type of “wait to see” price level, it remains to be seen to what degree their next major move is in sync. Will we have a Santa Claus rally in stocks? A continuation of the cliff dive move in bond yields? Both? Neither? And is this all just a ruse until the new year starts, and all heck breaks loose, as often occurs at the start of a new calendar period.