
Trending

In January, PhD economist, Wade Pfau, one of our nation’s most respected authorities on retirement decisions, co-authored, with CFA Massimo Young, yet another devastating critique of conventional financial planning. The study, tellingly titled, The Dangers of Monte Carlo Simulations, focused on conventional financial planning’s core element – Monte Carlo simulations of portfolio survival rates.
These survival rates determine whether a proposed investment strategy is viewed as safe. Safe, in this context, means having an 80 percent or higher probability of a client’s sustaining their retirement-spending target. The residual 20 percent potential failure rate? That’s the probability the client goes broke, whether in the near term, mid retirement, or closer to the end of life. No economists would view a one-in-five chance of insolvency as “safe,” but this is conventional planning’s “fiduciary” standard.
The Pfau-Young (PY) Findings
The PY study shows that conventional Monte Carlo analysis and its associated portfolio advice is hypersensitive to planner assumptions about the joint distribution of asset returns. Consider, for example, Planner A and Planner B who are choosing to invest the same client, Jane (PY’s hypothetical age-65 client), in just two assets -- stocks and corporate bonds. Jane is of middle-class means. Her sole asset is a $1 million IRA.
Planner A assumes stocks will yield 5.15 percent real, on average. Planner B is far more upbeat. She assumes equities will average 10.63 percent real. These are the low and high values value reported by Horizon Actuarial Services, which surveys the capital market assumptions of some 40 major Wall Street firms. Their median value, by the way, is 7.80 percent real.
Let’s further assume the two planners work for large financial institutions. In this case, A and B will likely be compelled to use their company’s chosen software loaded up with their company’s asset-distribution assumptions.
How a “20 Percent” Probability of Ruin Can Be Miles Higher
If both planners assume the same average real return on corporate bonds that median respondents to Horizon’s survey are adopting and make the survey’s median volatility and correlation assumptions, the two planners will deliver dramatically different portfolio advice.
Following PY’s example and standard practice, both planners’ will guide their clients to follow the industry’s “safe” 4 percent rule. After taxes and other factors, this entails setting Jane’s real annual spending at $41,200. What about Jane’s asset allocation? Assuming an average stock return of 7.80 percent real, Jane can, PY tell us, sustain, 80 percent of the time, her spending by adopting a 60-40 stock-bond portfolio. Stated differently, this portfolio leaves Jane with an 80 percent probability of remaining solvent through age 95.
What about Planner A? He recommends a 20-80 portfolio mix. This maximizes the probability of success under the 4 percent spending rule. Even so, Jane’s success probability drops from 80 percent to 65 percent. Thus, in following the 4 percent rule, Jane has a 35 percent chance of running out of money sometime over the next 30 years – this despite investing cautiously. When might Jane run out? PY don’t provides those disturbing stats.
Planner B? She urges Jane invest on an 80-20 basis. This raises Jane’s success probability to 95 percent! But what if Planner B has it wrong? What if Jane invests with Planner B, but Planner A’s far less optimistic assumptions are correct. Then Jane ends up with a 43 percent chance of going broke!
Can Planner B run Jane through her software with different distribution assumptions? Surely not if she works for one of the big boys. Again, large advisory software is designed to run based solely on company assumptions. There’s a reason, namely security and compliance.
The Story Gets Worse
PY also characterize the huge risk underlying conventional Monte Carlo in terms of spending guidance. Whereas the median advisor/advisory recommends Jane spend $41,200 annually, Planner B might well advise Jane to spend $52,000 per year. Yes, that’s far higher, but, as Planner B tells Jane, “Spending $52K annually will let you live a little and still have a safe, 80 percent chance of staying afloat.” Planner A, on the other hand, counsels Jane that spending $33,000 annually is the most she can do safely – the amount a one in five chance of impoverishment permits.
Hence, if Jane hires Planner B and follows her portfolio and spending advice, but Planner A’s return assumptions are correct, Jane will end up investing as well as spending far too aggressively. Indeed, her spending, as long as her money lasts, will be 58 percent too high. What about Jane’s probability of reaching Game Over? It’s now far higher than 20 percent. Indeed, it likely exceeds 50 percent.
My Takeaway from PY
Conventional Financial Planning is Far Worse than Anyone Knew!
I’ve long, including recently, argued, albeit from a highly self-interested position, that conventional planning fails to meet a reasonable economics standard. Whether conventional planning meets the industry’s fiduciary standard is for FINRA (The Financial Industry Regulatory Authority) to decide.
The Difference Between Economics-Based and Conventional Financial Planning
Unlike conventional planning, economics doesn’t countenance putting your pre-retirement saving (at what its likely a far too low a level) on autopilot, putting your post-retirement spending on autopilot (at a desired as opposed to affordable level), and then investing at sufficient risk to achieve a 20 percent probability of destitution.
That’s not something any sentient client would accept were they to understand their conventional financial “plan’s” true implications. These include a goodly chance of experiencing long years of penury. Indeed, FINRA should compel conventional planning tools to report the Quickest Path to Poverty – the first year any Monte Carlo generates financial ruin. Such reporting would surely make clear to clients in an instant that their “safe” plan is extremely risky.
Full Disclosure
I’m an economist and the founder of Economic Security Planning, Inc. We market economics-based lifetime financial planning, specifically, MaxiFi Planner. It features reality-based planning – planning based on what households can afford, not their generally unattainable
“needs.” Households that invest at risk are shown the living standard downsides and upsides of their joint investment and spending decisions, with spending guidance adjusting annually to the client’s portfolio performance.
Why Is Conventional Monte Carlo So Sensitive to Asset-Return Distribution Assumptions?
By putting retirement spending on autopilot, conventional planning maximizes sequence of return risk – the danger of selling low and buying high. When investments tank, failing to reduce spending means selling (divesting) more assets than makes sense precisely when the price is low. And when investments soar, failing to raise spending means buying (retaining) more assets than makes sense precisely when the price is high. Intentionally compounding sequence of return risk is, of course, worse when there is more return risk to compound. This helps explain why assuming return distributions that are more variable or have higher averages, given the same variability, can produce very different conventional Monte Carlo investment results as well as portfolio and spending advice.
Why Economics-Based Monte Carlo Investment-Simulations Are More Robust
To date, the only financial planning tool delivering economics-based financial planning is my company’s MaxiFi Planner program. Hence, I’m obliged to use this program to illustrate that economics-based investment Monte-Carlo (MC) analysis doesn’t suffer from the hyper-sensitivity-to-distribution-return assumptions disclosed by PY. MaxiFi Planner runs in two modes.
Upside Investing
The first is called Upside Investing. It entails only upside living standard risk. Upside Investing sets a floor to the client’s living standard based on the client’s investment in TIPS (Treasury Inflation Protected Securities). Any investment in risky assets (stocks) are assumed fully lost until they are converted, in retirement, to TIPS. Hence, the client only spends out of safe assets and experiences no downside investment-based living standard risk. During the stock accumulation phase there are no withdraws from the stock portfolio and, thus, there is no sequence of return risk. Upside Investing simulates, via Monte Carlo, alternative living standard upside trajectories, each of which exceed the client’s living standard floor. The reason there is only upside risk? As conversions of stocks to TIPS occur, MaxiFi realizes the client has more safe assets from which to spend and raises the client’s sustainable living standard floor.
Full Risk Investing
MaxiFi’s alternative, Full Risk Investing analysis, models clients’ annually spending based on the collect value of all their assets – risky as well as safe. Like Upside Investing, Full Risk Investing’s MC simulates annual living standard trajectories. Along these trajectories, MaxiFi adjusts clients’ annual spending levels. If the client’s assets have performed well, MaxiFi has the client spend more. If the client’s assets do poorly, MaxiFi has the client spend less. These spending adjustments are preset by the planner based on whether they want their client to spend conservatively, cautiously, or aggressively. But the key point here is that Full Risk Investing entails both downside and upside living standard risk. Also, what’s being simulated is the spending guidance the client would receive each year in their annual plan update.
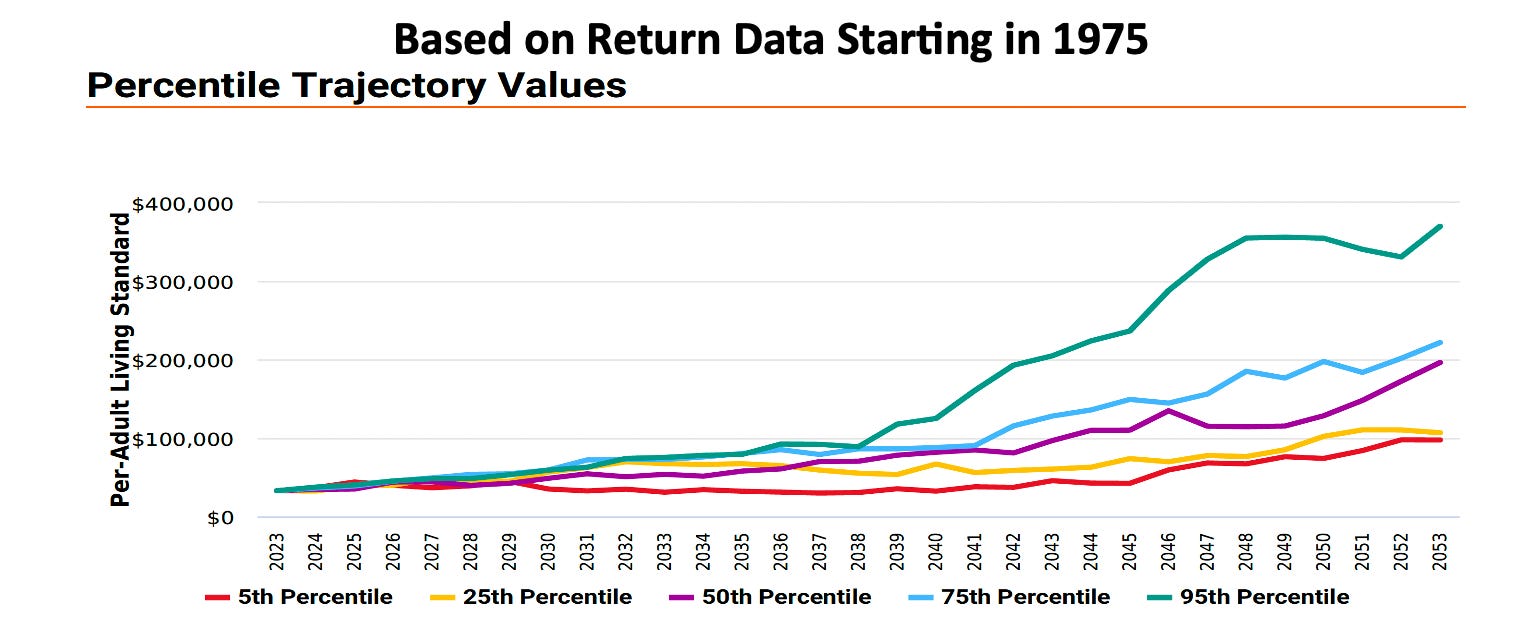
The figures and tables below examine MaxiFi’s Full Risk Investing’s sensitivity return distribution assumptions. Each figure and table examines Jane’s living standard (her annual discretionary spending) assuming she invests 60-40 in stocks and corporate bonds. The underlying four return distributions are joint log normally distributed and calibrated based on data post 1926, post 1950, post 1975, and post 2000.
The first table shows that the distributions differ substantially. What period one considers materially impacts the average return and standard deviation of the 60-40 portfolio. The figures show 5th, 25th, 50th, 75th, and 95th highest lifetime living standard trajectories across 500 MC simulations as ranked by their average annual value. And the final set of tables present living-standard trajectory statistics.
Findings
First, the difference in return distributions don’t change the underlying conclusion emanating from all four sets of Full Risk Investing MC simulations. Jane, even if she does well, indeed exceptionally well, on average, is in for a very bumpy living-standard ride. The living standard trajectories entail a very substantial degree of variation from year to year. This is true along every trajectory in ever figure. Third, Jane faces considerable downside living standard risk under all four return distributions. Fourth, regardless of the precise return distribution considered, putting Jane in a 60-40 portfolio is hardly “safe” even if she adjusts her spending annually based on her portfolio’s performance.
Were Planner A and Planner B to show Jane the degree of livings-standard variability she was going to experience in the best of circumstances, she surely would not opt for a 60-40 portfolio. This is the sense in which economics-based planning delivers the same message across all four distributions. Indeed, Jane, like almost all low and middle-income households should be advised to do Upside Investing, producing ensuring she has a floor to her living standard while still enjoying the prospect of a decent upside.
Conclusion
The Wade Pfau and Massimo Young study doesn’t directly object to conventional planning’s methodology. Instead, it shows that, conventional planning, as implemented in practice, is dangerous. It entails massive extra risk that no one had previously recognized. In clarifying this risk, PY reinforce the view of mainstream economics:
Conventional Financial Planning is Unsafe at any Speed.
This, of course, borrows from Ralph Nader’s characterization of the Corvair. Having nearly died in my dad’s spanking new, red Corvair, Nader was dead on.
Statistics Underlying the Four Return Distributions


Related: Why QLACs May Be a Very Bad Bet