
Written by: Matt Berger
Many investors are tempted to pour (or keep) too much money into cash these days—and it carries a big price tag in lost opportunities. What can we do?
This isn’t the first time that we at Lincoln Financial Group have been puzzled by the “cash conundrum,” in which some investors appear to be acting against their own best interests. But we have learned a few lessons over the years—specifically in previous instances in which money market assets ballooned to highs in 2003, 2009, and immediately after Covid hit. Here’s what you should know, and a few steps you can take with your clients to help emotional decisions become more logical.
We’re seeing the highest cash peak ever in U.S. history
Money market assets have ballooned to $5.4 trillion, and flows are showing no signs of stopping.1
Many investors — who are still saving for retirement or have recently retired and need their money to last for decades — are concerned about the impact of inflation, the ever-looming specter of recession, bank collapses, and the chaos of volatility. And in many cases, cash seems to be the solution.
Understandably, the siren song of relative safety along with 4% to 5% yields on cash (for the first time in a decade and a half) is playing a part in luring investors into money markets. But safety often comes with a cost.
Our friends at Allianz recently conducted a survey and found that “More than half of Americans (63%) are keeping more money out of the market than they think they should, and 62% would rather have their money sit in cash than endure market swings.”
Granted, cash yields are attractive, but it’s important to remind investors that they’re not guaranteed to stay this high, and even if they do, the expected return on cash is still well below the historical long-term return of stocks.
And that’s the problem. While cash can play an important role within portfolios, today's investors often are not aligning their cash holdings to their long-term goals.
Instead, many are overweight cash, which until just recently, was losing significant purchasing power due to inflation, despite attractive yields.
We oftentimes see cash as a “safe” investment and subconsciously turn a blind eye to the underlying risks – namely opportunity cost.
The price tag of lost opportunities
Interestingly, previous peaks in money market assets came well after the big stock sell-offs — we humans are terrible market timers. Legendary investor Charlie Munger, Warren Buffet’s closest partner and vice chairman of Berkshire Hathaway, once said “The big money is not in the buying and selling, but in the waiting.”
But contrary to his wisdom as a long-term investor, waves of market participants have been moving en masse to cash well after the bottom has fallen out of stocks. Chances are, many will sit tight until they feel it’s completely safe to move back into stocks — often missing the market rebound.
Let’s put some numbers behind the opportunity cost of sitting in cash. What annual return did investors see if they held stocks vs. cash for the three-year period following these recent cash spikes?2
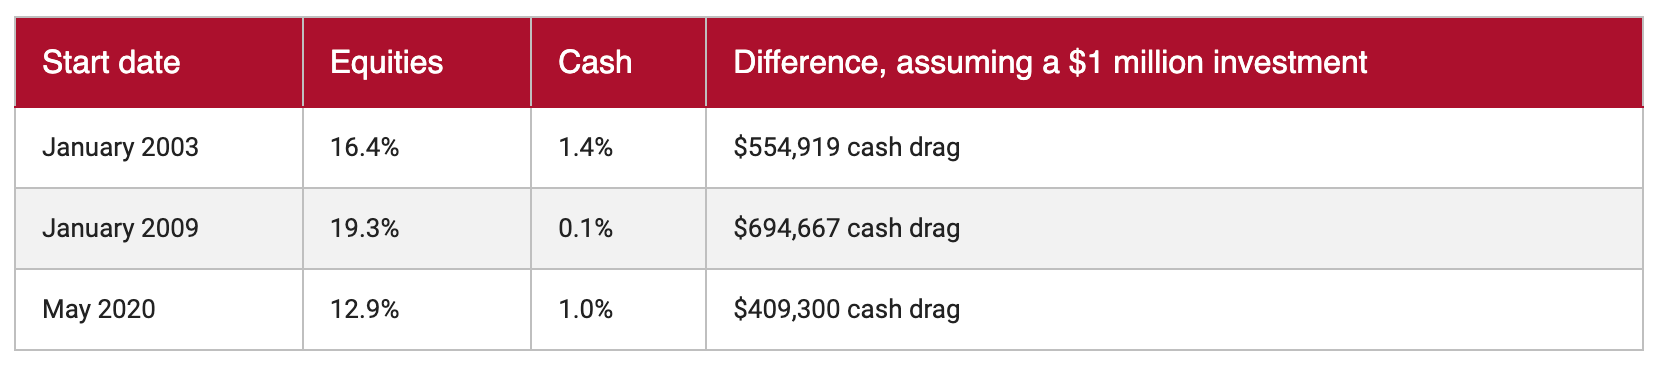
That averages to over half a million in potential gains sacrificed on a $1 million investment over just a three-year period! To put these returns into perspective, on average, the S&P 500 returned just over 10% annually since 1926.3 Thus, these recovery periods typically play an outsized role in overall returns.
Holding cash comes with a steep cost — and the longer you hold it, the more growth opportunity you sacrifice. It’s called cash drag, and it can have serious long-term implications on portfolio outcomes.
An emotional flight to cash...after the market rallied?
The most recent example of the opportunity cost of cash can be seen in what has happened since U.S. stocks bottomed in October of last year, down 25% from their high. Since that low, investors have pulled $110 billion out of U.S. and international equity mutual funds and ETFs, while pouring more than $750 billion into money market funds.4
In the meantime, what happened in markets?5
- Money market funds are up 2.8%
- U.S. stocks are up 26%
- International stocks are up by more than 32%
Despite this, headlines and the 24/7 newsfeed continue to stoke fears of recession, geopolitical risk, and inflation, and many investors — including our clients — may still be nervous.
Ways to help clients get ready to roll with the bull
What are the elements that really build wealth? It’s time, growth potential, tax efficiencies, and commitment…or to think about it another way, courage. Some of your clients may be concerned, but with a little knowledge, you can help them capitalize on the new bull market.
- The Cash Conundrum presentation allows you to start this important conversation with your clients.
- You can actively participate in the market through Lincoln’s annuities, life insurance, long term care and retirement plans—which all provide varying levels of protection.
- Market Intel Exchange offers easily digestible market information for fact-based, not emotional, decisions.
- And stay tuned for my next article covering three reasons to invest with confidence.
Knowledge, savvy investing, potentially combined with portfolio protection, can help give your clients the fortitude to stay the course through market volatility, especially when they see so many others fleeing to perceived “safety.”
Partner with us: As always, if you have any questions, please contact your Lincoln representative today at 877-533-0265. And follow us on LinkedIn for regular insights and tips on retirement income planning conversations.
Related: Three Things You Should Know as You Guide Female Clients
1 Morningstar, data as of June 2023.
2 Morningstar, "BlackRock Student of the Markets." U.S. Stocks = S&P 500 TR; Money Market = Morningstar taxable money market category average returns.
3 "BlackRock Student of the Market," May 2023.
4, 5 Morningstar estimated net flows of U.S. open-end mutual funds, ETFs and money market funds as of 6/30/23. Source for returns: Morningstar as of 6/30/23. Indices for returns: International stocks = MSCI EAFE NR, U,S. Stocks = S&P 500 TR; Money market = average return of Morningstar category U.S. Fund Money Market- Taxable.
Lincoln Financial Group® affiliates, their distributors, and their respective employees, representatives and/or insurance agents do not provide tax, accounting or legal advice. Please consult an independent professional as to any tax, accounting or legal statements made herein.
The views expressed are those of the author and not necessarily of any Lincoln Financial Group affiliate or the broker-dealer, or any affiliates. These views are not based on any particularized financial situation, or need, and are not intended to be, and should not be construed as, a forecast, research, investment advice or a recommendation for any specific strategy, product or service.
Past performance is not indicative of future results.
Lincoln Financial Group is the marketing name for Lincoln National Corporation and its affiliates, including broker-dealer/distributor Lincoln Financial Distributors, Inc., Radnor, PA, and insurance company affiliates The Lincoln National Life Insurance Company, Fort Wayne, IN, and Lincoln Life & Annuity Company of New York, Syracuse, NY.
Affiliates are separately responsible for their own financial and contractual obligations.