
Trending

Scary selling yesterday? See how little the downswing has achieved technically, check out the other characteristics, and you‘ll probably reach the same conclusion I did. It‘s still about the tech getting its act together while much of the rest of the market is doing quite fine.
The credit market confirm, as is obvious from the HYG:SHY ratio chart I‘m showing you. True, long-term Treasuries are under pressure, but I wrote on Monday that not even considerably higher rates would break the bulls‘ back. The dollar isn‘t getting far, and given tomorrow‘s non-farm payrolls, which are expected to be rather bad… Check instead another chart I am featuring today, and that‘s volatility – this correction appears in its latter stages as the crash callers „now, this quarter, whenever because it‘s allegedly overdue“, will be again surprised and backtracking in tone once the market gets what it wants: more liquidity.
That was stocks, what about gold? No shortage of gloomy charts there, accompanied by various calls for a local bottom. The most bullish one (me included, talks about a possible bottom being made here, with the $1,700 to $1,690 zone able to stop the downside. I am though also raising the lower border of the Apr-May 2020 consolidation, which is around $1,670, as an even stronger support (over $40 lower than the above one) than the volume profile based one we‘re still at currently – and based on different tools, I am far from alone. The doomsayers‘ scary clickbaitish targets of $1,500 or $1,350 are in the minority, and about as helpful as calls for $100 silver before years‘ end.
As I always say, let‘s be realistic, honest, and act with real integrity. People deserve better than to be played around through fear or greed.
Silver remains in a solid uptrend, and so does platinum. Regardless of today‘s premarket downswing taking copper over 4% down as we speak, commodities are happily running higher in the face of „no inflation here, move along“ calls. How far is the Fed announcing yield curve control, or at least a twist program? Markets crave more intervention, and those calling for rate hikes to materialize soon, are landing with egg on their faces – mark my words, the Fed is going to stay accommodative longer than generally anticipated – have we learned nothing from the Yellen Fed?
Let‘s move right into the charts (all courtesy of www.stockcharts.com).
S&P 500 Outlook and Its Internals

Yesterday‘s downswing didn‘t attract outstanding volume, and didn‘t overcome Fri‘s one. Regardless of the visit to the lower border of recent trading range, the bears would have to become more active to flip this chart bearish really.
Credit Markets

The key leading credit market ratio – high yield corporate bonds to short-dated Treasuries (HYG:SHY) – hasn‘t really broken down yesterday. Just a consolidation that has an inverse head and shoulders shape on top. Of course, until the neckline is broken, there are no bullish implications, but I am looking for higher HYG:SHY values regardless.
Volatility

Yesterday‘s volatility – and put/call readings too – are very tame, and that detracts from the credibility of a significant downswing starting here considerably.
Technology
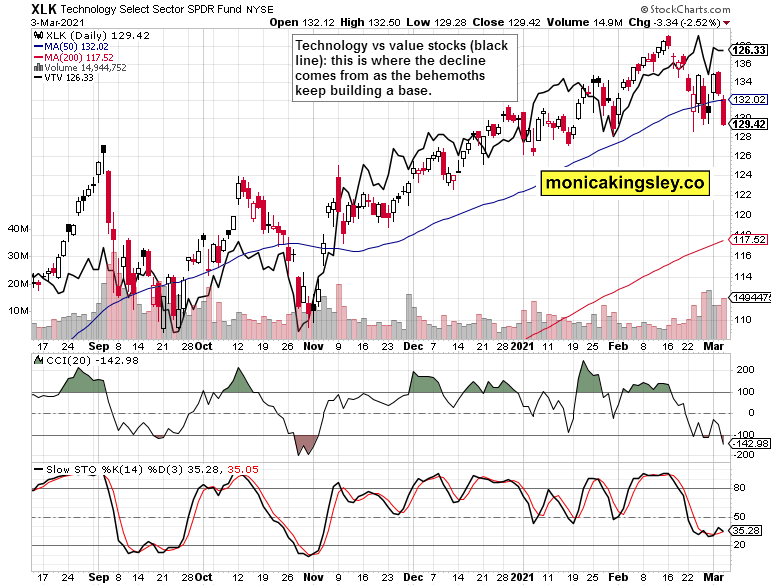
Technology (XLK ETF) compared to the value stocks (VTV ETF) shows clearly once again the performance difference – tech still taking time and basing, while value sectors and high-beta segments keep doing largely fine. This view isn‘t one that‘s associated with the onset of real corrections – but with waiting for the tech to start behaving for new highs to be attainable once again.
Gold and Silver

Gold still has a good chance to rebound higher, even though it missed yesterday‘s opportunity that would have resulted in a nice hammer candlestick. Nevermind, we have to live with what we have – and the support is still unbroken, not ruling out an upswing in the least. Yes, regardless of the deeply negative Force index which really wasted each prior opportunity to turn positive this winter. The metals would do well to get used to living with higher nominal rates really, when the real rates are little changed.
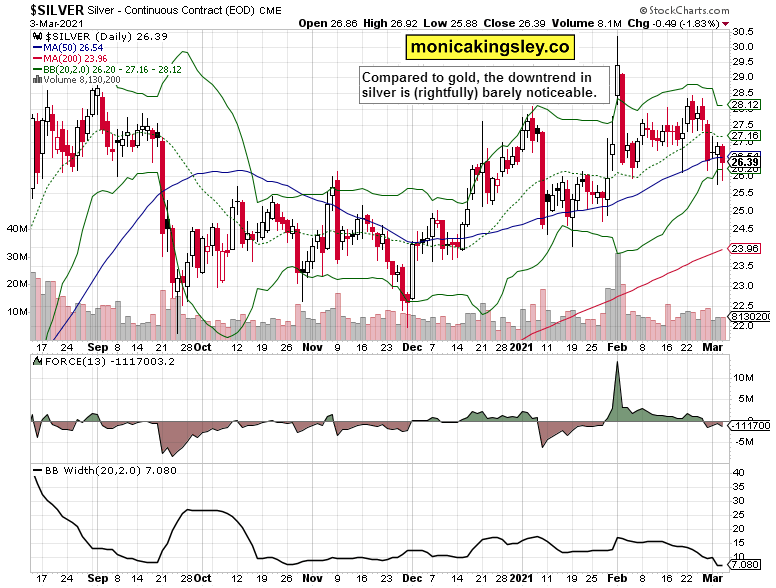
Silver keeps doing much better, which is little surprising given the economic recovery, leading indicators not weakening, manufacturing activity doing fine – it‘s a versatile metal, both industrial and monetary after all. Compare how little has its Force index declined vs. gold – this is rather a bullish chart, unlike gold still searching for direction (i.e. without an established uptrend).
Copper

Let‘s compare the red metal (perched high, digesting steep Feb gains) to platinum and silver. I‘m featuring copper as the key determinant for precious metals, also given the positive Mar seasonality. The above chart fittingly illustrates the bull market‘s strength – and the waiting on gold to join.
Summary
Stock bulls have to once again take the trip to the 3,900 mark, and when that happens, depends on the tech the most. The S&P 500 internals and credit market performance remains sound, and new highs are a question of time (and stimulus).
Gold remains stuck in its support zone, unable to rally, not breaking down. While copper is retreating today, the technical odds favor a rebound off this support. Once that happens, it would be though still too early to call for the new gold bull upleg to resume – much more would need to happen, such as the miners doing really well, and so on. But we‘ll get there.
Thank you for having read today‘s free analysis, which is available in full here at my homesite. There, you can subscribe to the free Monica‘s Insider Club, which features real-time trade calls and intraday updates for both Stock Trading Signals and Gold Trading Signals.
Related: What Correction in Stocks? And Gold?
The views and opinions expressed in this article are those of the contributor, and do not represent the views of IRIS Media Works and Advisorpedia. Readers should not consider statements made by the contributor as formal recommendations and should consult their financial advisor before making any investment decisions. To read our full disclosure, please click here.