
Trending

An old adage says investors should “Sell May And Go Away.”
The historical analysis suggests summer months of the market tend to be the weakest of the year. The mathematical statistics prove this as $10,000 invested in the market from November to April vastly outperformed that amount invested from May through October.
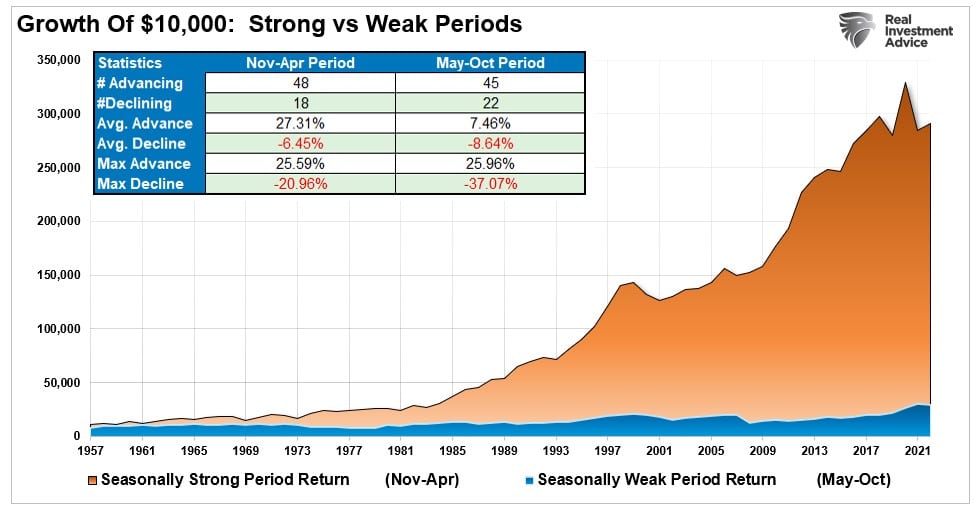
Interestingly, the max drawdowns are significantly larger during the “Sell In May” periods. Previous important dates of major market declines occurred in October 1929, 1987, and 2008.
However, not every summer works out poorly. Historically, there are many periods where “Sell In May” did not work and markets rose. 2020 and 2021 were examples where massive Federal Reserve interventions pushed prices higher in April and subsequent summer months. However, 2022 was the opposite as April declined sharply as the Fed began an aggressive interest rate hiking campaign the preceding month.
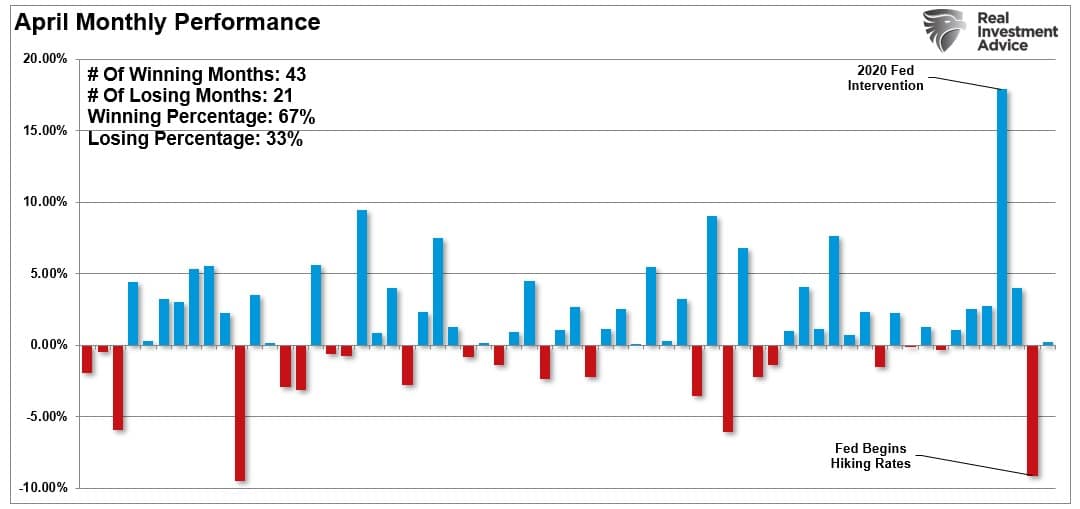
As the end of April approaches, will 2023 be another year where the “Sell In May” strategy works? While no one knows the answer, historical statistics, current economic indicators, and technical measures suggest some caution is warranted.
A Reversal Of Liquidity
Before we discuss where we are currently, a quick review of the previous analysis is needed for context.
We discussed that the correction following the strong January rally had likely started in February.
“Over the next few weeks, the ‘pain trade’ is likely lower as the correction continues. If the bulls win this battle, those crucial support levels will hold. If not, we will likely begin a more profound decline as bearish fundamentals take over.”
The bears did indeed gain control, and markets slid into mid-March. We then penned “Bullish Buy Signals Mark 4200 For Relief Rally.”
“However, with these buy signals in place, investors should modestly increase equity exposure, as the likely path for stock prices is higher over the next two weeks to two months. As shown, the most likely target for the S&P 500 is 4200 before serious resistance is encountered and a reasonable level to take profits and again reduce risk.”
While the market did not rally to 4200, it got close and peaked with an intraday high of 4168.
Another support for that rally came from the Fed’s bailout of the banks following the Silicon Valley Bank failure. As discussed in “Not QE,” these loans to the banks were not technically QE. However, from the market’s perspective, the Fed’s balance sheet increase was “the ringing of Pavlov’s bell.”
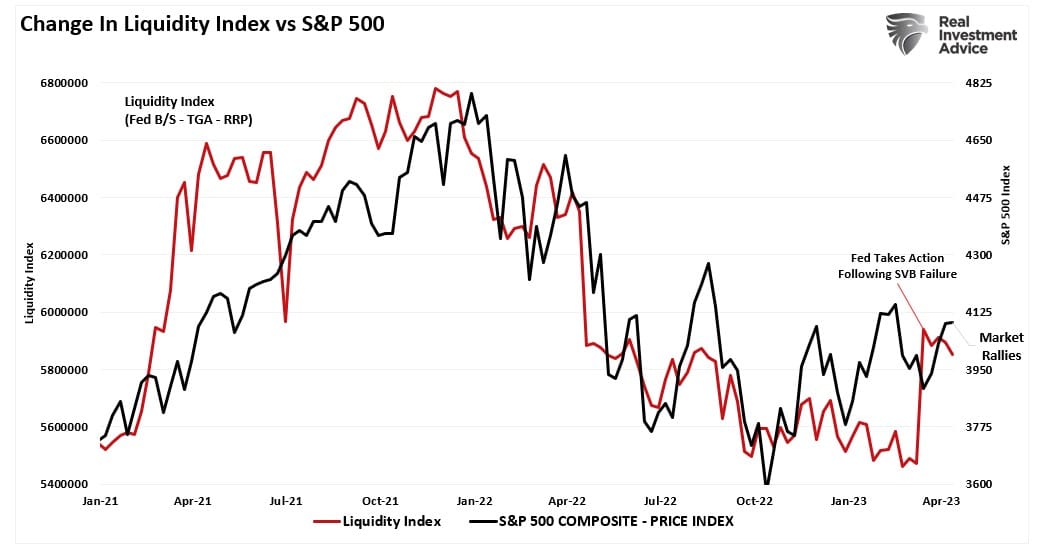
“Another way to look at this is through the liquidity measure of the Fed’s balance sheet, less the Treasury general account, less the Fed’s reserve program. That combined measure has a decent correlation with changes in the market.”
The chart below is annotated and updated since that report. Not surprisingly, given the historical correlation between the liquidity index and the S&P 500, the market rallied in response to the liquidity increase. As we approach the “Sell May” period, that liquidity index is declining and will likely fall further as the Treasury and the Government wrestle over the impending debt ceiling.
As noted, it isn’t just the reversal of liquidity that suggests that selling May may be prudent, but also the technical and economic indications.
Indicators Suggest Caution
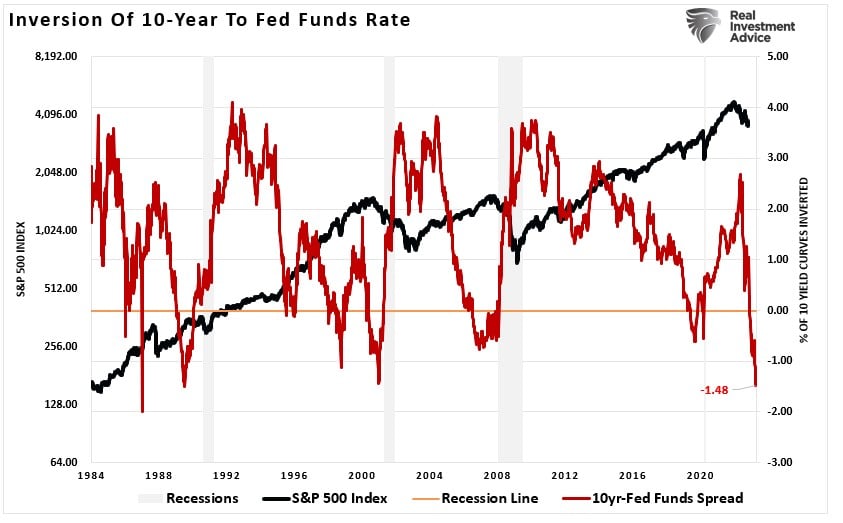
In the latest Bull Bear Report, I discussed that many indicators are undoubtedly concerning and suggest an “official” economic recession is likely. The inversion of the Fed Funds rate to the 10-year Treasury is the most inverted since 1986 (roughly 10-months before the 1987 market crash.)
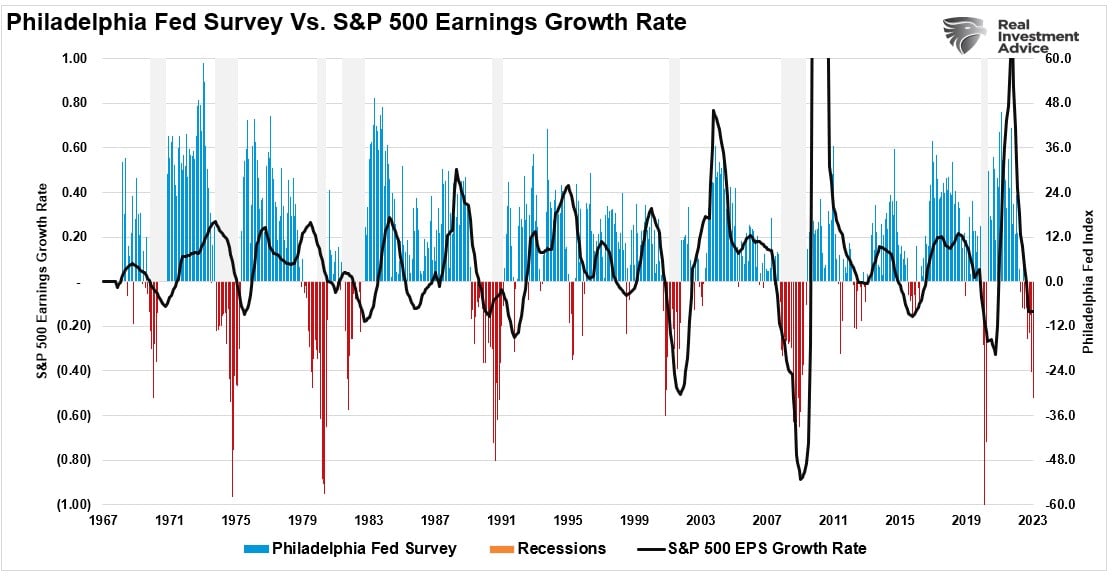
Furthermore, the most recent release of the Philadelphia Federal Reserve Manufacturing Index showed a sharp plunge in sentiment, suggesting a more pronounced correction than earnings currently represent. Historically, such deep readings of the “Philly Fed” index were associated with harder, not softer, economic recessions.
However, in the short term, it is the technical price action that we pay the closest attention to. Such is because the price action represents the psychology of the market. Those technical indicators were the primary drivers behind reducing exposure to the markets in February and increasing again in March. The vertical lines represent each “buy” and “sell” signal over the last year.
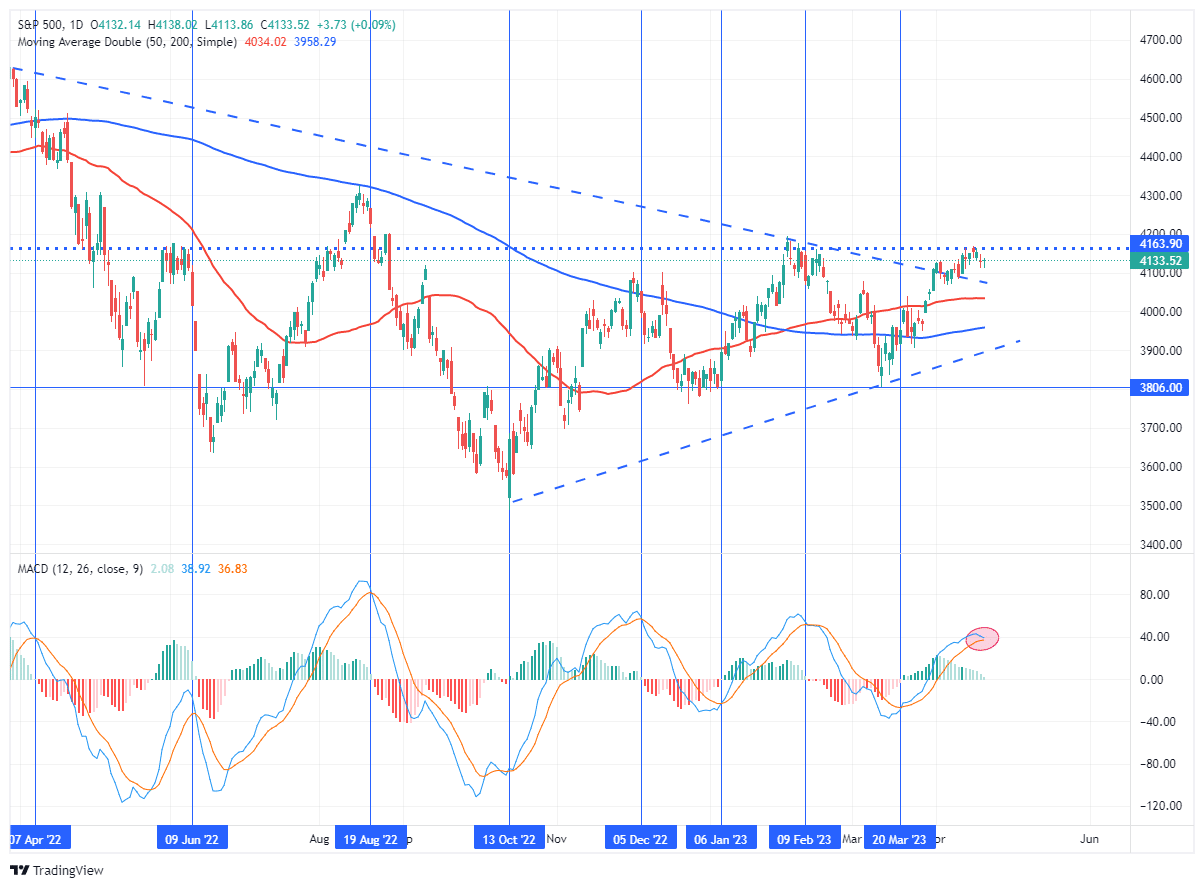
While these signals are not timing indicators to “be all in or out” of the market, they have consistently provided good signals to increase and reduce exposure to equity risk accordingly.
Those indicators suggest that investors may be well served to “Sell May” and return later.
The Fed Set To Hike Rates
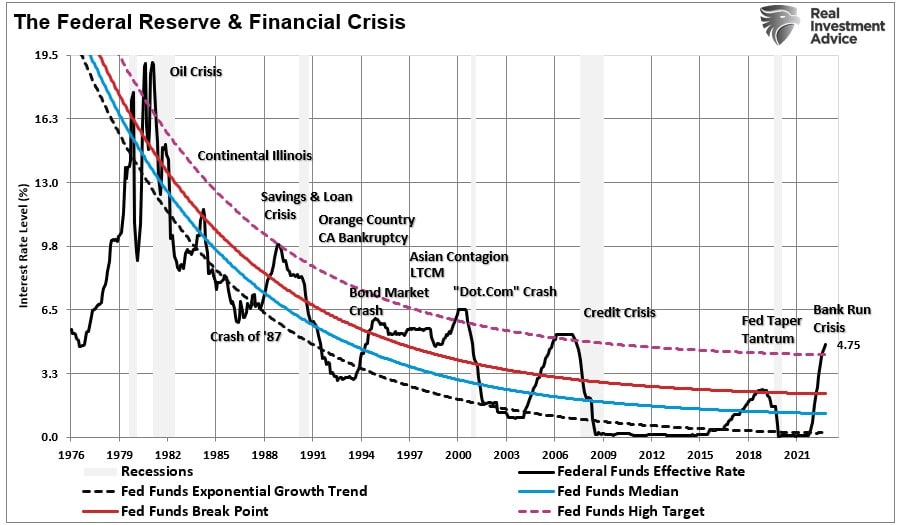
While the technical indications may be enough warning on their own to reduce risk heading into May, it is worth remembering the Fed is set to hike rates again on the 5th. With each rate hike, we are getting closer to the Federal Reserve breaking something economically or financially. Such has repeatedly been the case throughout history and given the aggressiveness of the rate hiking campaign over the last year, a negative outcome would be unsurprising.
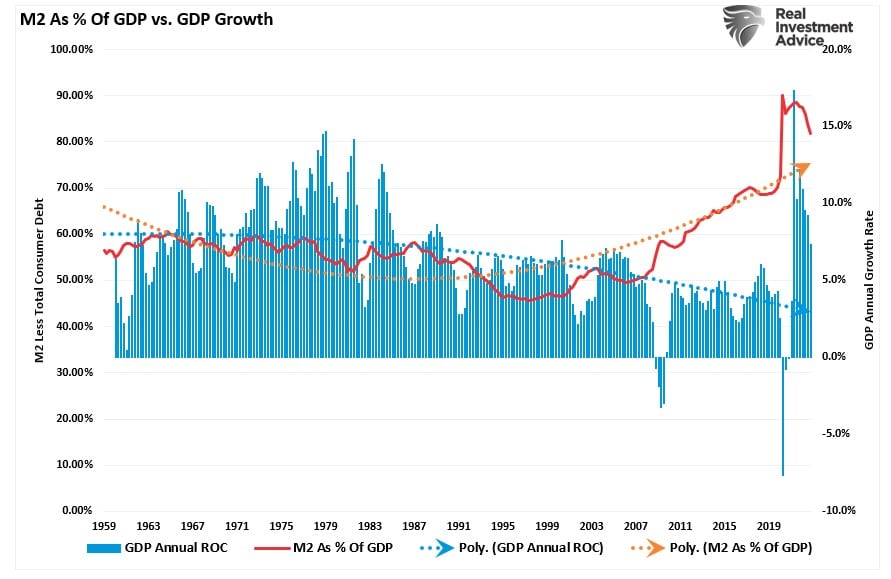
So far, the markets have weathered the rate increase much better than expected. However, most of those rate hikes have yet to work through the economic system. Furthermore, the economy has remained buoyed by the massive increase in money supply, which still supports economic activity. But that support is also fading as the last vestiges of pandemic support programs end.
As we enter the traditionally weak summer months, we must note that the market’s bullish trend remains intact. However, as I concluded this past weekend:
“A correction should be acknowledged and expected. A 10% decline would lead to another retracement to the lows of the bullish trend channel, as noted above. If that support holds, that would be a logical place to add exposure to risk assets from a purely technical perspective.”
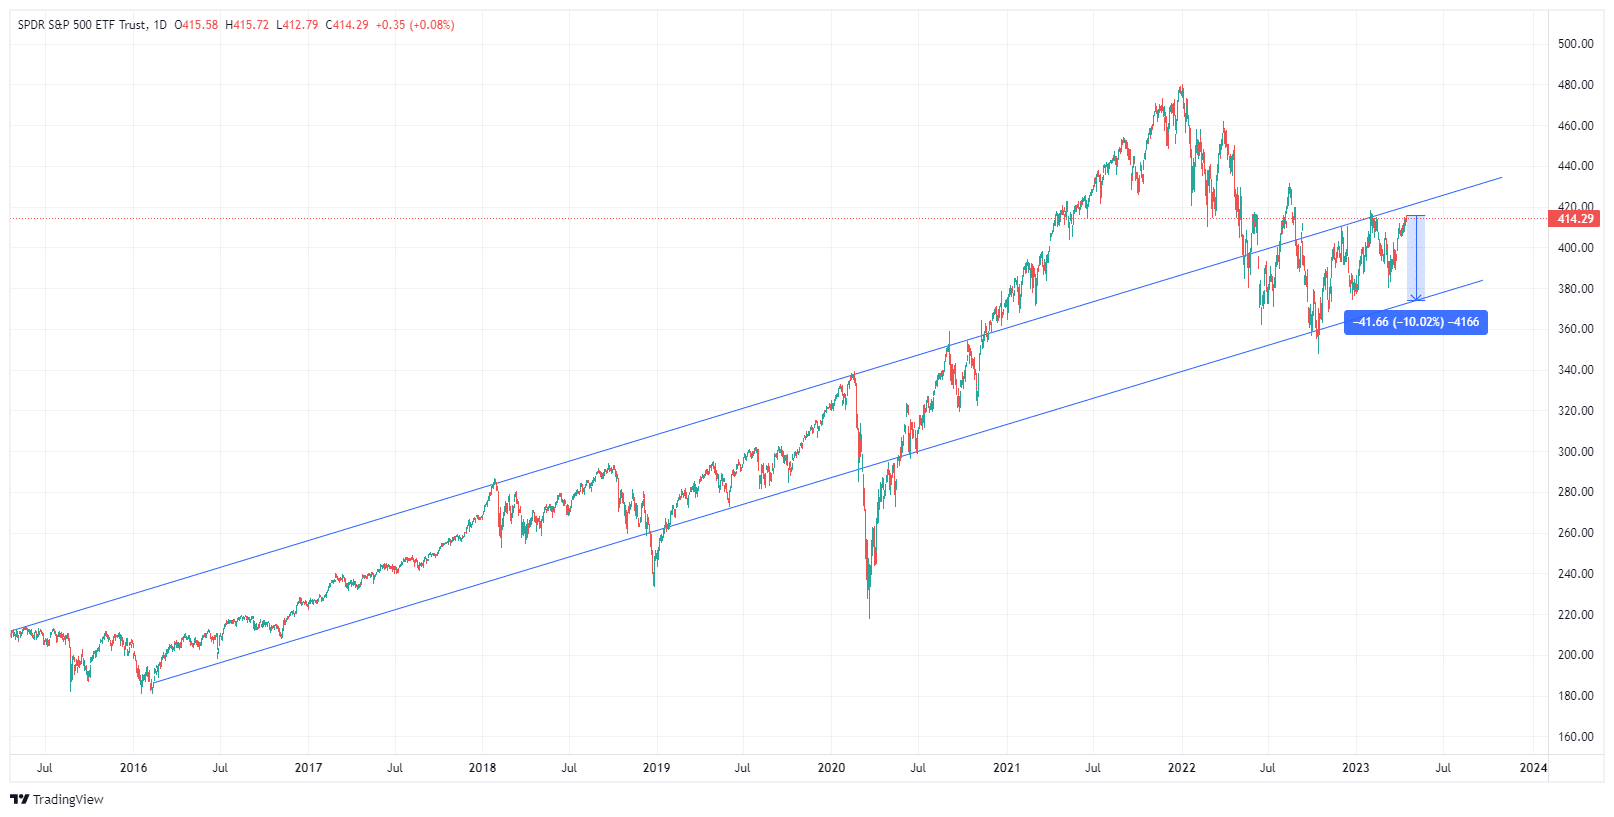
A correction should be acknowledged and expected. A 10% decline would lead to another retracement to the lows of the bullish trend channel, as noted above. If that support holds, that would be a logical place to add exposure to risk assets from a purely technical perspective.
For these reasons, we have raised cash and reduced equity risk in portfolios as we head into the seasonally weak summer months. Could we be wrong to “sell May” and go away until later? It is certainly possible, and if such is indeed the case, we will add exposure accordingly when needed.
However, being cautious heading into the summer may pay extra dividends.