
Trending

Could massive monetary support have softened the deep bear market many expected? It is an interesting question. Particularly given the Fed has hiked rates at one of the most aggressive paces in history. Combined with inverted yield curves, surging debt levels, and weak economic data, a recession and bear market seem assured.
I always shudder at the four most dangerous words in investing, “this time is different.“ However, could the massive amount of monetary support combined with trillions in Government spending change historical outcomes?
One of my favorite Twitter follows, @MichaelAArouet, recently posted a compelling question.
“What are the odds that the fastest tightening cycle combined with highest debt/GDP level will end up in a soft landing?”
Here is the chart to support his question.
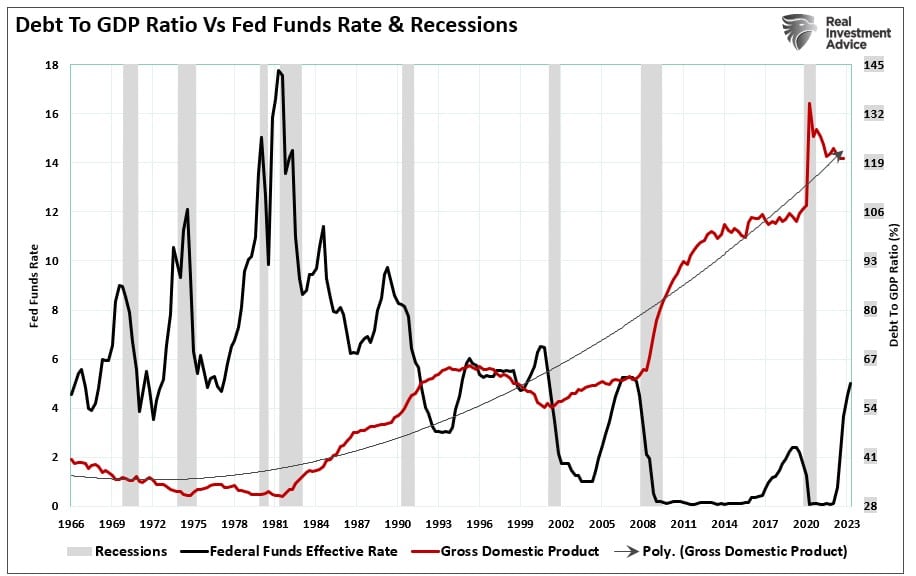
What is clear is that since 1981, the Federal Government has been on a rampant spending spree. To Michael’s point, low-interest rates supported increasing debt levels, and previous rate hike cycles inevitably ended in recession. Such is logical given that rate increases divert economic spending to debt service.
Such is seen in the chart below, which shows that increased debt levels subsequently lower economic growth rates. (The chart uses data based on CBO projections for debt levels and the BEA projections for potential inflation-adjusted GDP.)

While politicians consistently focus on spending more money to help the citizenry, the outcomes have been far less favorable. As discussed in “Taking Risk Is No Longer Necessary,” since 1982, economic prosperity has shifted from the middle class to the top 10% of income earners.
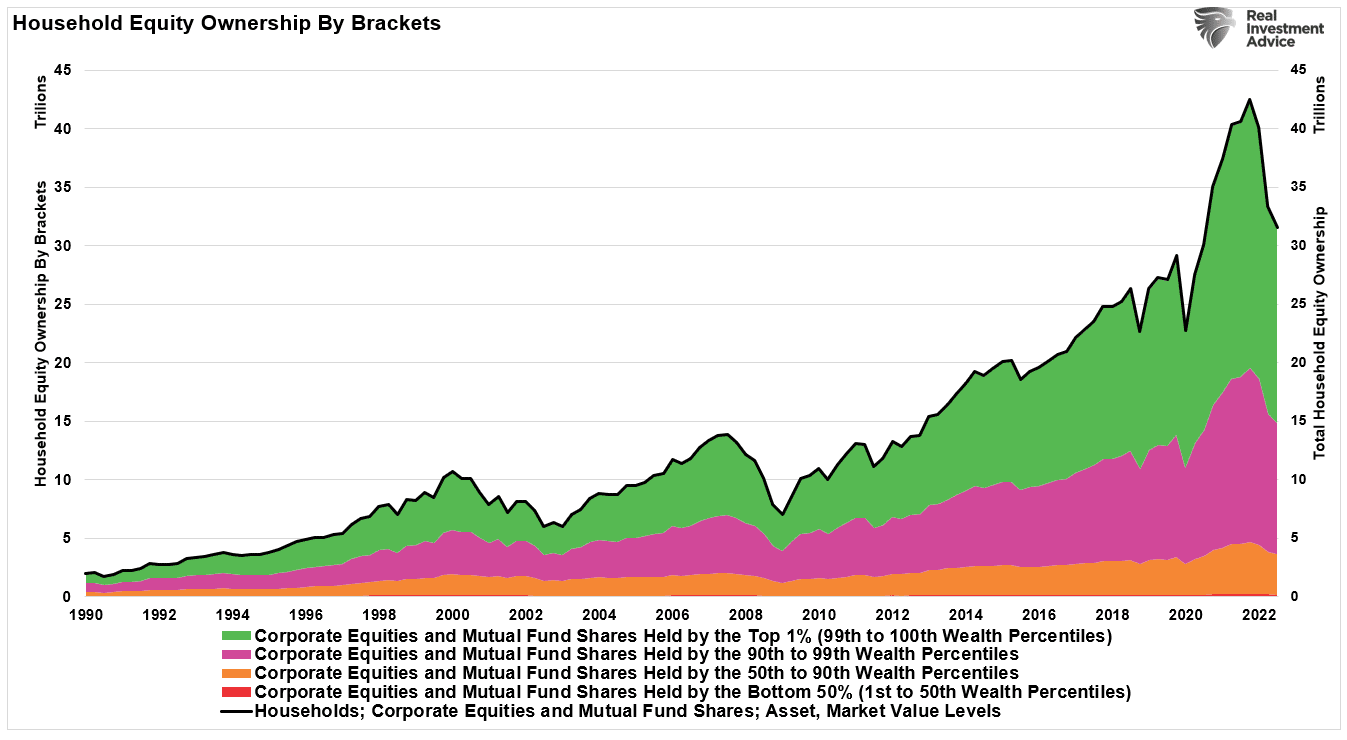
This shift from the middle class, combined with the massive fiscal and monetary supports of 2020 and 2021, introduces an exciting dynamic concerning Michael’s question. One issue many may be overlooking is that despite higher rates, the economy, and by extension, the stock market, maybe more resilient than expected.
Monetary Support Is Still High
One aspect of monetary support that much of the mainstream media overlooks was the massive Inflation Reduction Act of $1.7 Trillion that was on top of the more than $5 Trillion in direct stimulus payments during the Pandemic era.
Beginning in 2000, the “money supply” as a percentage of GDP grew sharply, with each Administration ratcheting up debt to pay for politically driven agendas. However, in 2020, monetary support changed radically by sending checks directly to households. That resulted in both a “surge” in economic activity and inflation due to “reopening” from an artificially manufactured “shutdown.”
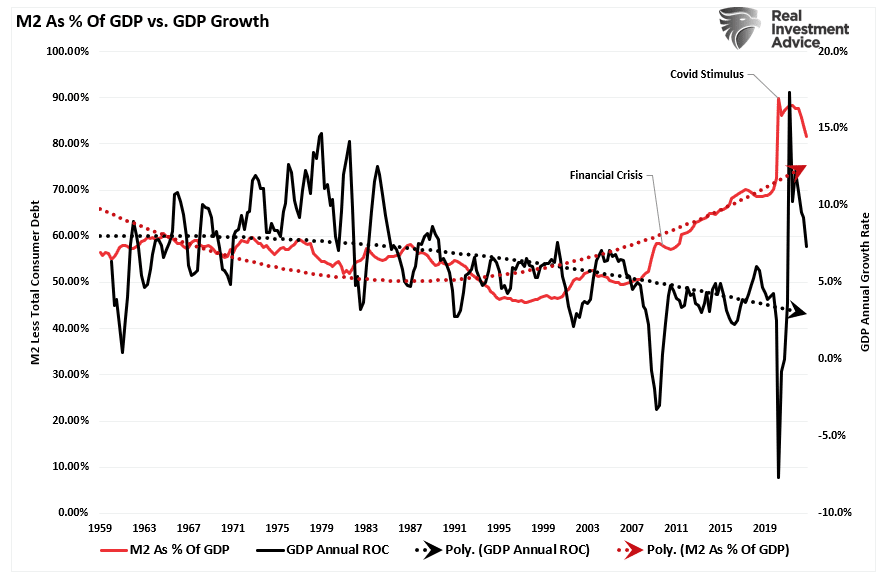
As shown, M2, a measure of monetary liquidity, is still highly elevated as a percentage of GDP. This “pig in the python” still moves through the economic system. The massive deviation from previous growth trends will require an extended time frame for reversion. Such is why calls for a “recession” have been early, and the data continues to surprise economists.
Federal Spending Ramps Up
However, another overlooked aspect of monetary support could keep the economy from a more profound recessionary drag. In 2022 the Biden Administration was finally able to force through $1.7 Trillion in Federal spending in the Inflation Reduction Act. Those funds are getting spent in 2023 to start various projects, which will provide economic support in the near term, regardless of their success or failure.
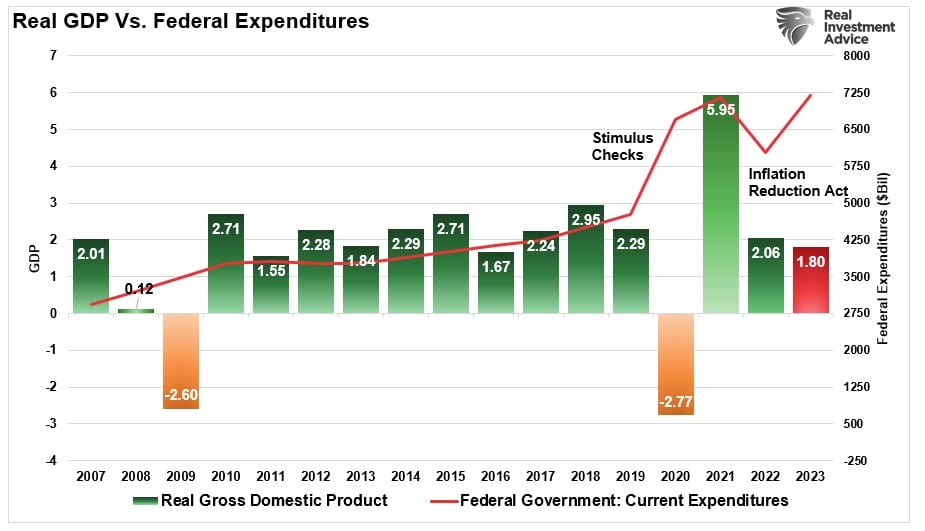
In the first quarter of 2023, Federal spending increased by 3% on a quarter-over-quarter basis. Using that increase as a baseline, we can project federal spending through the end of the year, which will eclipse $7 Trillion at the current run rate. Of course, if the current Republican-controlled house can negotiate some spending cuts while raising the debt ceiling, that number will decline.
The point here is that while many economists and analysts are predicting a sharp slowdown and recession later this year, which is indeed possible, there is still a lot of liquidity supporting economic activity in the near term.
Is The Worst Behind Us?
As investors, we must ask whether the market suggests the worse is behind us. Since October, stocks have been in a decent rally, with the Nasdaq leading the charge in 2023. That rally is noteworthy because the stock market leads the economy by 6-9 months.
However, this is the dichotomy that investors currently face. We have repeatedly noted the various recessionary indicators such as inverted yield curves, the 6-month rate of change of the Leading Economic Index, and our Economic composite. These indicators have a flawless track record of predicting recessions over time. I have shown both the LEI rate-of-change and the Economic Composite below. As noted, the current index readings are at levels consistent with recessions since 1974.
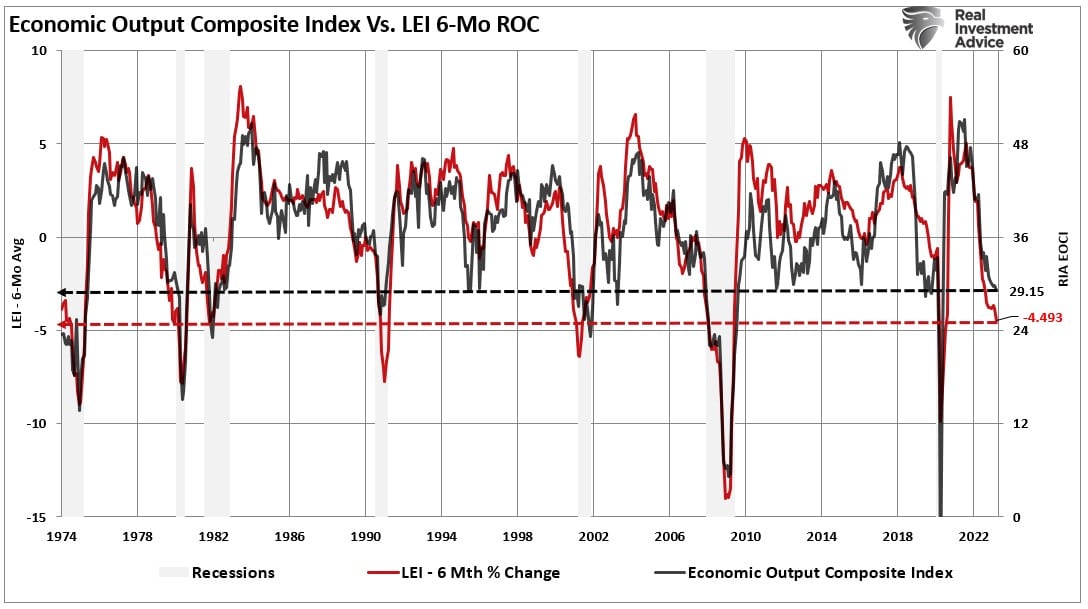
Given that economic data is primarily lagging, it will be some time before we know whether the current readings coincided with a recessionary slowdown. However, as noted by the two horizontal lines, outside of the 2020 and 2008 recessions, current readings are near levels that previously denoted recessionary lows.
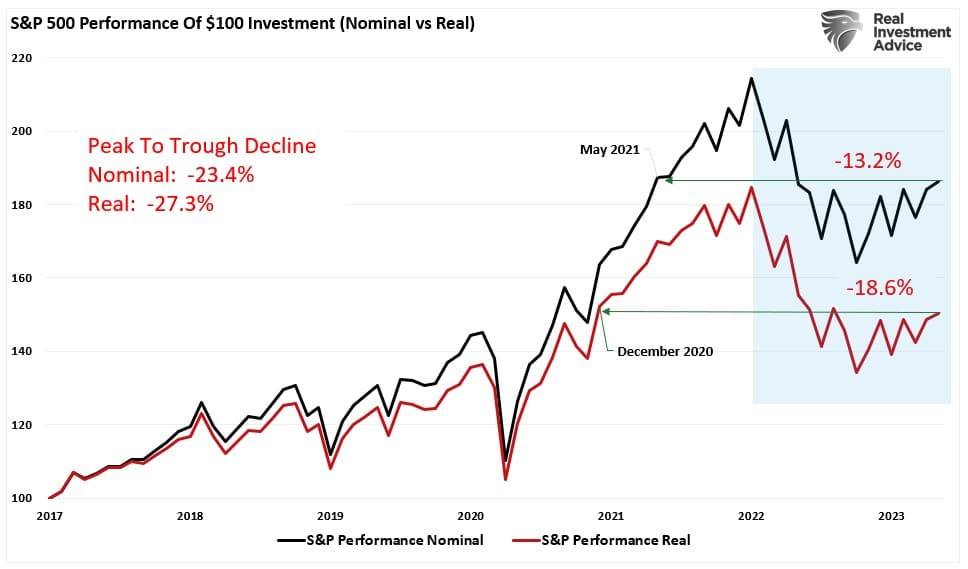
If such is the case, it is possible the recent rally in stocks, a leading indicator, combined with the ongoing monetary supports, suggests we may start to see some improvement in the economic data. If such is the case, then on an inflation-adjusted basis, the corrective market drawdown did achieve historical norms for recessionary periods.
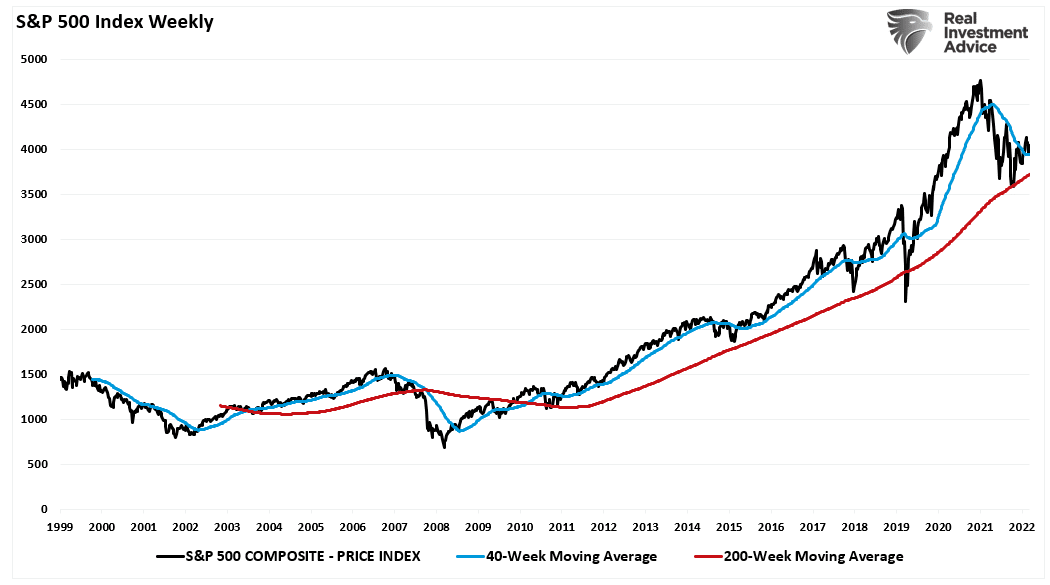
Furthermore, the correction process may be complete as it held critical support at the 200-week moving average. Such remains support for the market since the 2009 lows. Again, if we see some improvement in sentiment-driven and data-driven surveys, such will confirm the market is leading the economic progress.
Conclusion
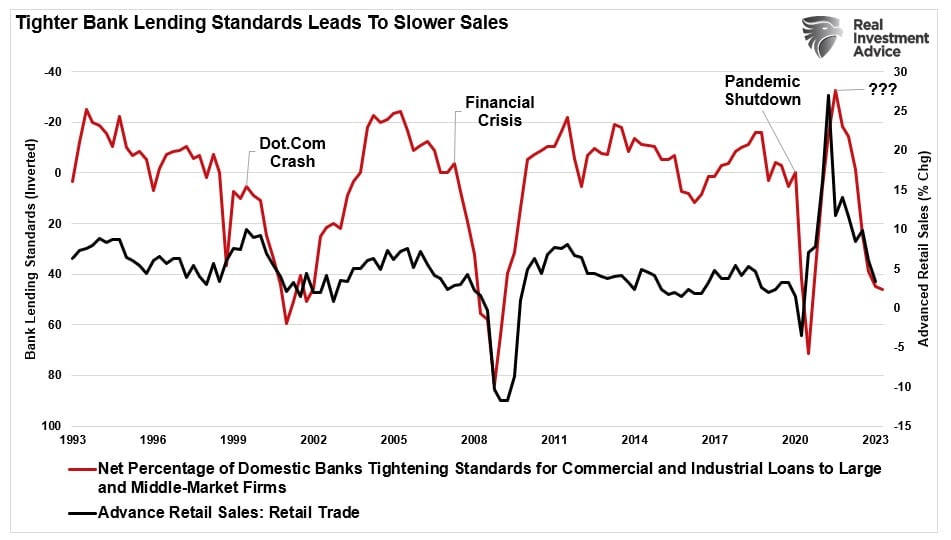
There are many arguments against the current market rally, given the lag effect of the Fed’s most aggressive rate hiking campaign since the 1970s. Furthermore, those rate hikes, and much tighter bank lending standards, will eventually reduce consumer spending. Such was the point made in “NFIB Sends Recession Alert.” To wit.
“However, tighter bank lending standards have always been a strong “recession alert” signal as it correlates with changes in retail sales. (Retail sales comprise roughly 40% of PCE, which is 70% of the GDP calculation.)”
I am not suggesting the markets, and the economy, won’t potentially struggle in the months ahead. However, we could avoid a deep economic due to the still massive amounts of monetary support in the system.
These competing forces will make investing more difficult until those monetary excesses reverse.
One thing is for sure. The volatility we have seen in the markets over the last year will likely continue. Investors should expect lower rates of future returns. Of course, that will result from much less monetary support and lower economic growth rates resulting from increased debt levels.
But that is an article for next time.