
Trending

During running bull markets, much commentary is written on why this time is different and why investors should not worry about market corrections. One such piece was written recently by Fisher Investments. To wit:
“After the S&P 500’s 26% return last year and this year’s strong start, many investors are worried – understandably – that this bull run is getting ahead of itself.
They shouldn’t. The strange-but-true fact is that, statistically speaking, average returns — which have amounted to about 10% a year over nearly a century of trading — aren’t normal in the stock market for any given year. A second, surprisingly pleasant fact is that so-called “extreme” returns are far closer to what we’d call normal — and they’re mostly on the positive side.”
There are a lot of problems with that statement, which we will get into. However, there are some essential facts about markets that should be understood. First, indeed, stocks rise more often than they fall. Historically speaking, the stock market increases about 73% of the time. The other 27% of the time, market corrections are reversing the excesses of the previous advance. The table below shows the dispersion of returns over time.
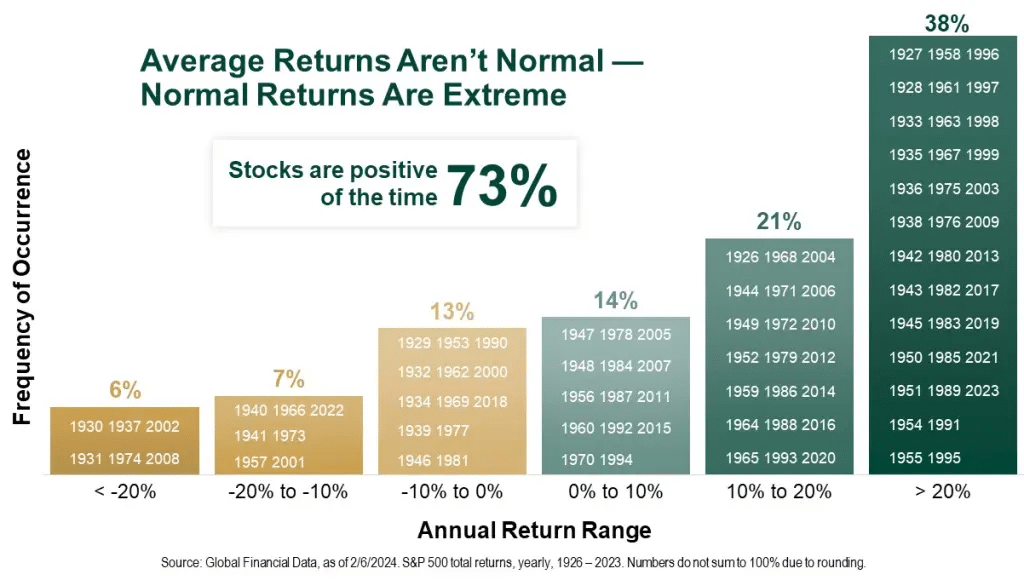
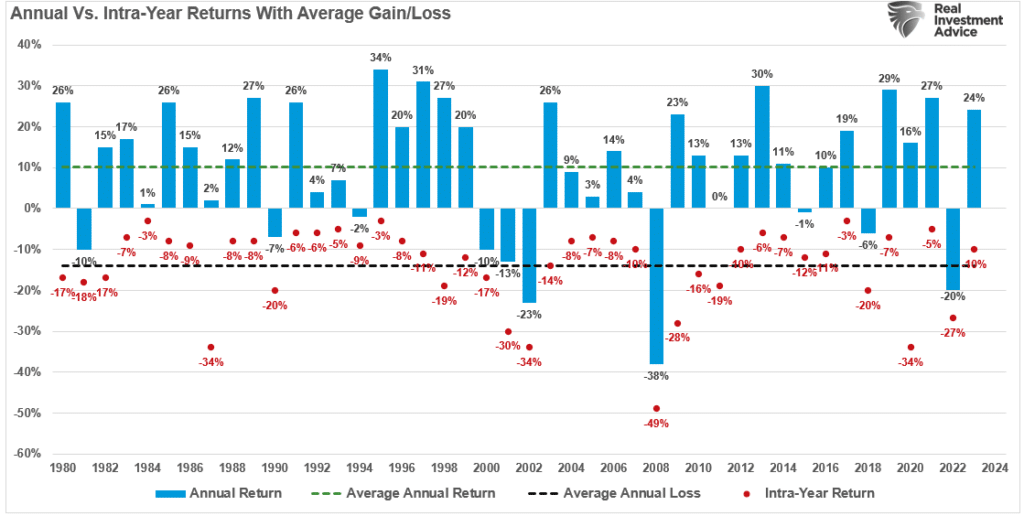
However, fairly substantial corrections have not been uncommon in those positive return years. As shown in the table below, intra-year corrections, which average roughly 10%, are common.
There is little to be concerned about as 38% of the time, the market is cranking out greater than 20% returns versus just 6% of 20% or more market corrections. As Mr. Fisher notes:
“The upshot? Big returns simply aren’t the rarity that “too far, too fast” bears claim. In bull markets, they are more normal than not. Why? The roughly 10% long-term annual average includes bear markets. Strip out the bears and you’ll find that during the 14 S&P 500 bull markets before this one, stocks annualized 23%.“
The problem with Mr. Fisher’s statement is that he doesn’t understand the math behind market corrections. As we will explain, a significant difference exists between a 20% advance and a 20% market correction. Such is particularly the case if you are in or approaching retirement.
Market Corrections And The Function Of Math
Notice that the table above uses percentage returns. As noted, that is a deceptive take if you don’t examine the issue beyond a cursory glance.
For example, assume an arbitrary stock market index that trades at 1000 points. Over the next 12 months, the index will increase by 20%. The index value is now 1200 points.
During the next 12 months, the index declines by one of those rare outliers of 20%. The index doesn’t just give up its gain of 200 points.
- 1200 x (-20%) = 240 points = 960 points
The investor now has an unrealized capital loss.
Let’s take this example further and assume the index goes from 1000 to 8000.
- 1000 to 2000 = 100% return
- From 1000 to 3000 = 200% return
- The next 1000 to 4000 = 300% return
- …
- The final 1000 to 8000 = 700% return
No one would argue that a 700% return on their money wasn’t fantastic. However, let’s do some math:
- 10% loss equals an 800-point decline, nearly wiping out the last 1000-point advance.
- 20% market correction is 1600 points
- 30% decline erases 2400 points.
- 40% loss equals 3200 points or nearly 50% of all the gains.
- 50% decline is 4000 points.
The problem with using percentages to measure an advance is that there is an unlimited upside. However, you can only lose 100%.
A Graphic Example
That is the problem of percentages. We can also show this graphically.
One of the charts often used by the “perma bulls” like Ken Fisher to coax individuals into not worrying about portfolio risk is measuring the cumulative advances and declines of the market in percentages. When presented this way, the bear market corrections are hardly noticeable. This chart is often used to convince individuals that bear markets don’t matter much over the long term.
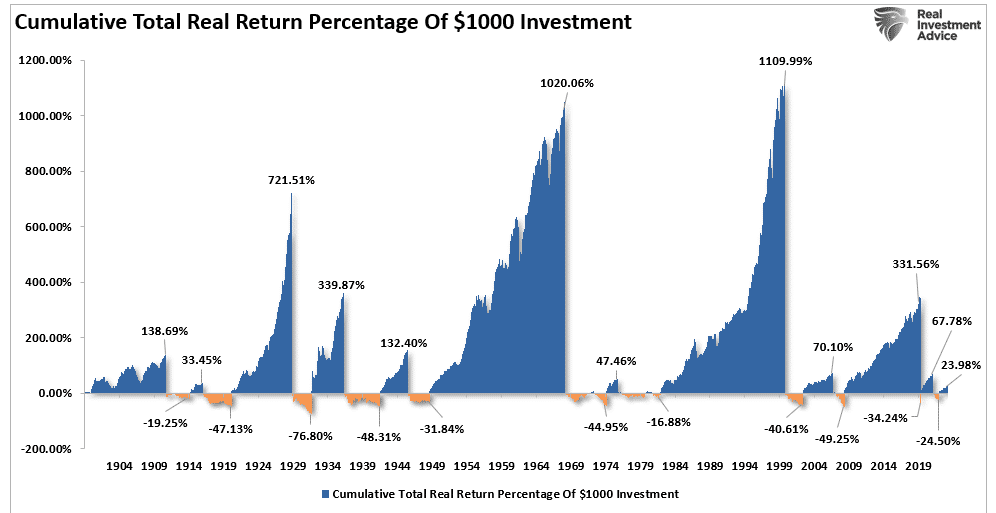
However, as noted above, this presentation is very deceptive due to how math works. If we change from percentages to actual point changes, the devastation of market corrections becomes more evident. Historically, the subsequent declines wiped out huge chunks of the previous advances. Of course, at the bottom of these market corrections, investors generally sell due to the mounting losses’ psychological pressures.
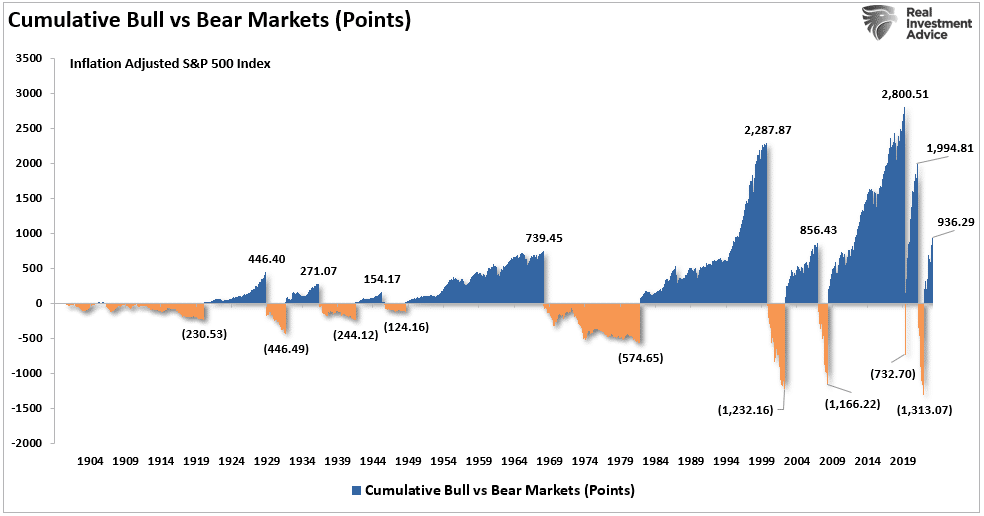
This is why, after two of the most significant bull markets in history, most individuals have very little money invested in the financial markets.
Average And Actual Returns Are Not The Same
There is a massive difference between AVERAGE and ACTUAL returns on invested capital. Thus, in any given year, the impact of losses destroys the annualized “compounding” effect of money.
The chart below shows the difference between “actual” investment returns and “average” returns over time. See the problem? The purple-shaded area and the market price graph show “average” returns of 7% annually. However, the return gap in “actual returns,” due to periods of capital destruction, is quite significant.
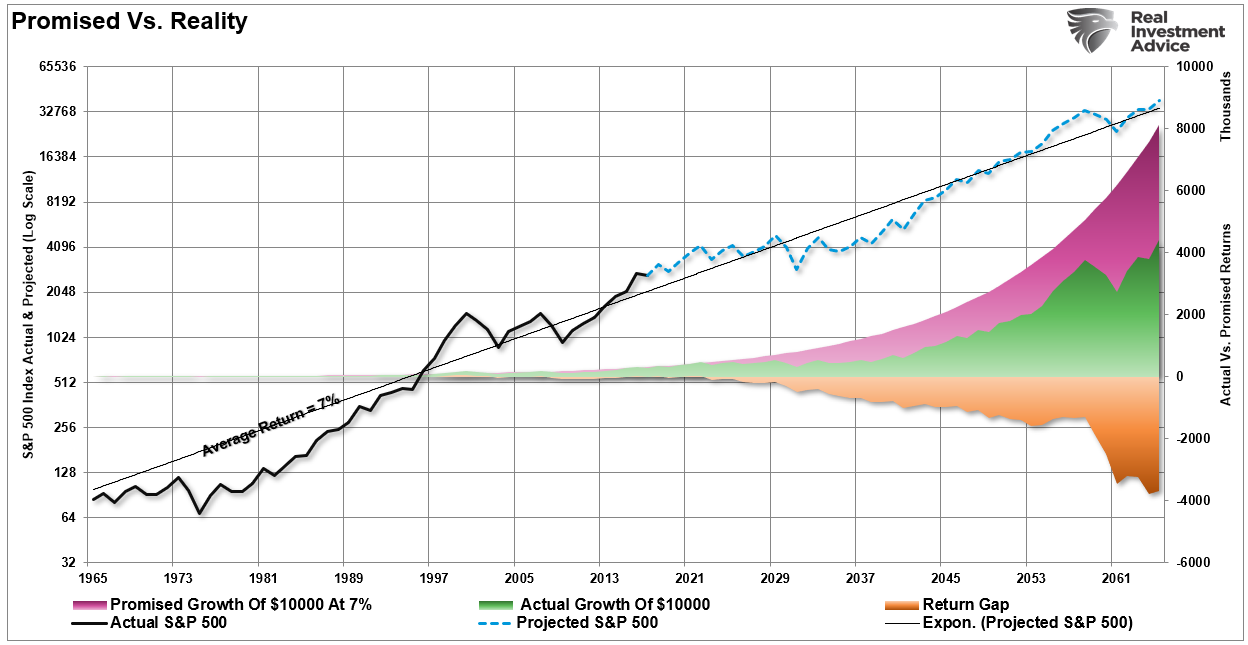
In the chart box below, I have taken a $1000 investment for each period and assumed the total return holding period until death. There are no withdrawals made. (Note: the periods from 1983 forward are still running as the investable life expectancy span is 40-plus years.)
The orange sloping line is the “promise” of 6% annualized compound returns. The black line represents what happened with invested capital from 35 years of age until death. At the bottom of each holding period, the bar chart shows the surplus, or shortfall, of the 6% annualized return goal.

At the point of death, the invested capital is short of the promised goal in every case except the current cycle starting in 2009. However, that cycle is yet to be complete, and the next significant downturn will likely reverse most, if not all, of those gains. Such is why using “compounded” or “average” rates of return in financial planning often leads to disappointment.
Three Key Considerations
Over the next few months, the markets can extend the current deviations from the long-term mean even further. But that is the nature of every bull market peak and bubble throughout history as the seeming impervious advance lures the last stock market “holdouts” back into the markets.
As such, three key considerations exist for individuals currently invested in the stock market.
- Time horizon (retirement age less starting age)
- Valuations at the beginning of the investment period.
- Rate of return required to achieve investment goals.
Suppose valuations are high at the beginning of the investment journey. In that case, if the time horizon is too short or the required rate of return is too high, the outcome of a “buy and hold” strategy will most likely disappoint expectations.
Mean reverting events expose the fallacies of “buy-and-hold” investment strategies. The “stock market” is NOT the same as a “high yield savings account,” and losses devastate retirement plans. (Ask any “boomer” who went through the dot.com crash or the financial crisis.”)
Therefore, during excessively high valuations, investors should consider opting for more “active” strategies with a goal of capital preservation.
As Vitaliy Katsenelson once wrote:
“Our goal is to win a war, and to do that we may need to lose a few battles in the interim. Yes, we want to make money, but it is even more important not to lose it.”
I agree with that statement, so we remain invested but hedged within our portfolios.
Unfortunately, most investors do not understand market dynamics and how prices are “ultimately bound by the laws of physics.” While prices can certainly seem to defy the law of gravity in the short term, the subsequent reversion from extremes has repeatedly led to catastrophic losses for investors who disregard the risk.
Just remember, in the market, there is no such thing as “bulls” or “bears.”
There are only those who “succeed” in reaching their investing goals and those who “fail.”
Related: Wealth Gap and the Road to Serfdom