
Trending

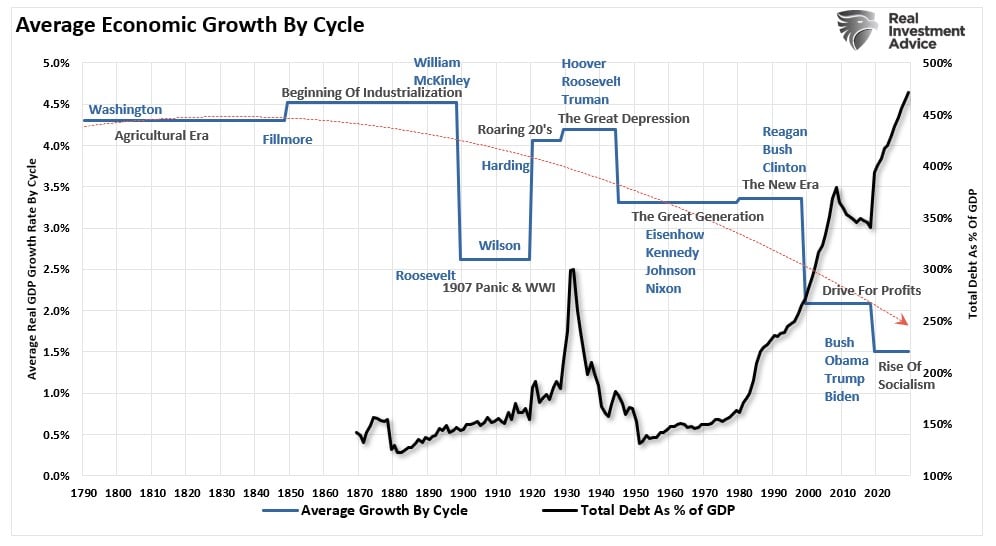
While Washington continues a seemingly unbridled spending spree under the assumption “more spending” is better, debts and deficits matter. To better understand the impact of debt and deficits on economic growth, we must know where we came from. The chart shows the 10-year annualized growth rate of the economy over time.
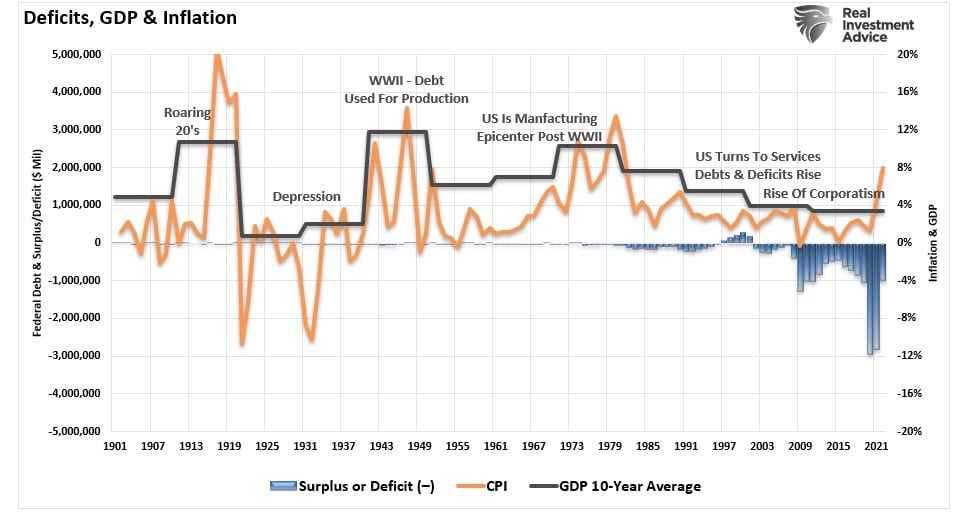
What should immediately jump out at you is that the 10-year average economic growth rate was around 8%, except for the Great Depression era, from 1900 through 1990. However, there has been a marked decline in economic growth since then.
The question is, why? Of course, that question has been a contentious debate over the last several years as debt and deficit levels in the U.S. have soared higher.
Causation? Or Correlation?
As I will explain, the case can be made the surge in debt is the culprit of slowing rates of economic growth. However, we must start our discussion with the Keynesian theory, which has been the main driver of fiscal and monetary policies over the last 30 years.
“Keynes contended that ‘a general glut would occur when aggregate demand for goods was insufficient, leading to an economic downturn resulting in losses of potential output due to unnecessarily high unemployment, which results from the defensive (or reactive) decisions of the producers.’
In such a situation, Keynesian economics states that government policies could be used to increase aggregate demand, thus increasing economic activity and reducing unemployment and deflation. Investment by government injects income, which results in more spending in the general economy, which in turn stimulates more production and investment involving still more income and spending. The initial stimulation starts a cascade of events, whose total increase in economic activity is a multiple of the original investment.”
Keynes’ was correct in his theory. For deficit spending to be effective, the “payback” from investments must yield a higher rate of return than the debt used to fund it.
The problem has been two-fold.
First, “deficit spending” was only supposed to be used during a recessionary period and reversed to a surplus during the subsequent expansion. However, beginning in the early ’80s, those in power only adhered to the “deficit spending part.” After all, “if a little deficit spending is good, a lot should be better,” right?
Secondly, deficit spending shifted away from productive investments, which create jobs (infrastructure and development), to primarily social welfare and debt service. Money used in this manner has a negative rate of return.
According to the Center On Budget & Policy Priorities, roughly 88% of every tax dollar goes to non-productive spending.
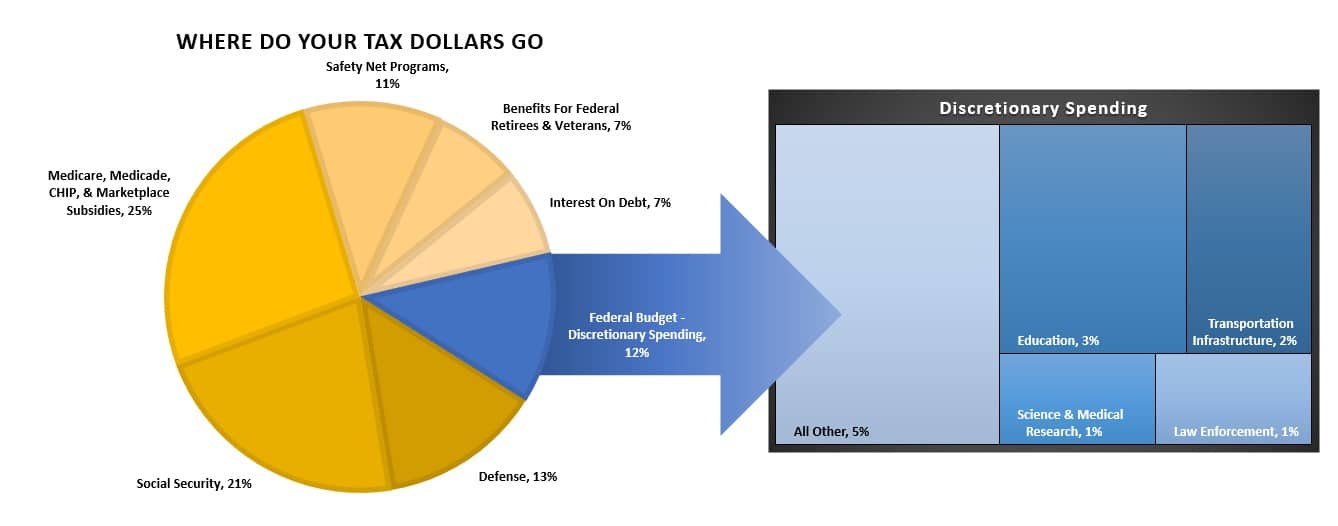
Here is the real kicker. In 2022, the Federal Government spent $6 Trillion, equivalent to almost 20% of the nation’s entire nominal GDP (19.74% to be exact.) Of that total spending, ONLY $5 Trillion was financed by Federal revenues, and $1 Trillion was funded through debt.
In other words, if 88% of all expenditures is social welfare and interest on the debt, those payments require $5.3 Trillion of the $5 Trillion (or 105%) of revenue.
Do you see the problem here? (In the financial markets, when you borrow from others to pay obligations you can’t afford, it is known as a “Ponzi scheme.”)
Debt Is The Cause, Not The Cure
This is one of the issues with MMT (Modern Monetary Theory,) in which it is assumed that “debts and deficits don’t matter” as long as there is no inflation. However, the premise fails to hold up when one pays attention to the debt and economic growth trends.
I won’t argue that “debt, specifically deficit spending, can be productive.” As I discussed in American Gridlock:
“The word “deficit” has no real meaning. Dr. Brock used the following example of two different countries.
Country A spends $4 Trillion with receipts of $3 Trillion. This leaves Country A with a $1 Trillion deficit. In order to make up the difference between the spending and the income, the Treasury must issue $1 Trillion in new debt. That new debt is used to cover the excess expenditures, but generates no income leaving a future hole that must be filled.
Country B spends $4 Trillion and receives $3 Trillion income. However, the $1 Trillion of excess, which was financed by debt, was invested into projects, infrastructure, that produced a positive rate of return. There is no deficit as the rate of return on the investment funds the “deficit” over time.
There is no disagreement about the need for government spending. The disagreement is with the abuse, and waste, of it.”
The U.S. is Country A.
Increases in the national debt have long been squandered on increases in social welfare programs and, ultimately, higher debt service, which has an effective negative return on investment. Therefore, the larger the debt balance, the more economically destructive it is by diverting increasing amounts of dollars from productive assets to debt service.
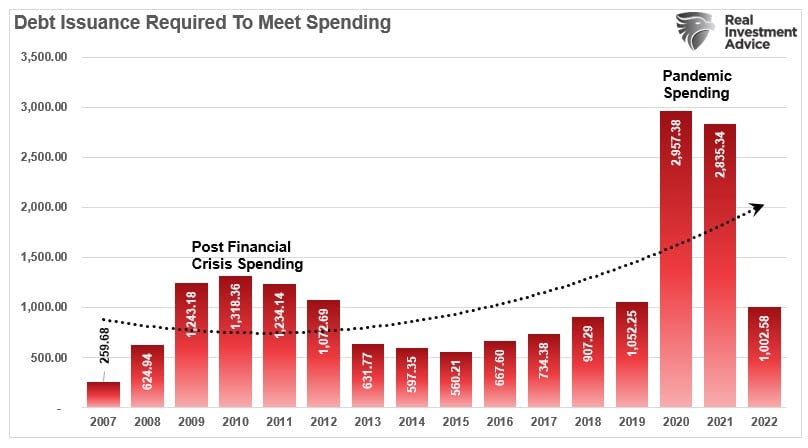
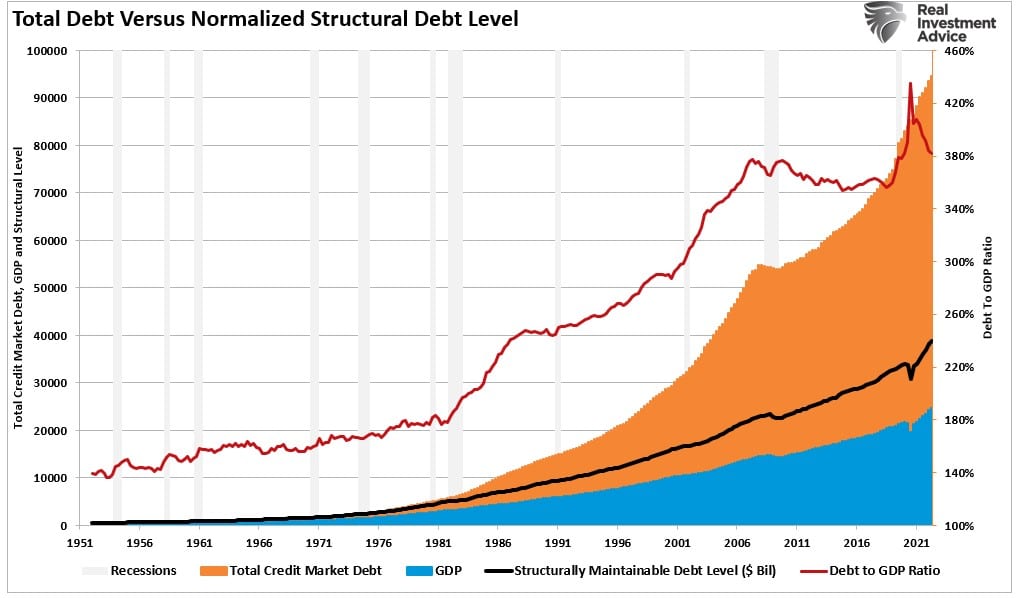
The relevance of debt versus economic growth is evident, as shown below. Since 1980, the overall increase in debt has surged to levels that currently usurp the entirety of economic growth. With economic growth rates now at the lowest levels on record, the change in debt continues to divert more tax dollars away from productive investments into the service of debt and social welfare.

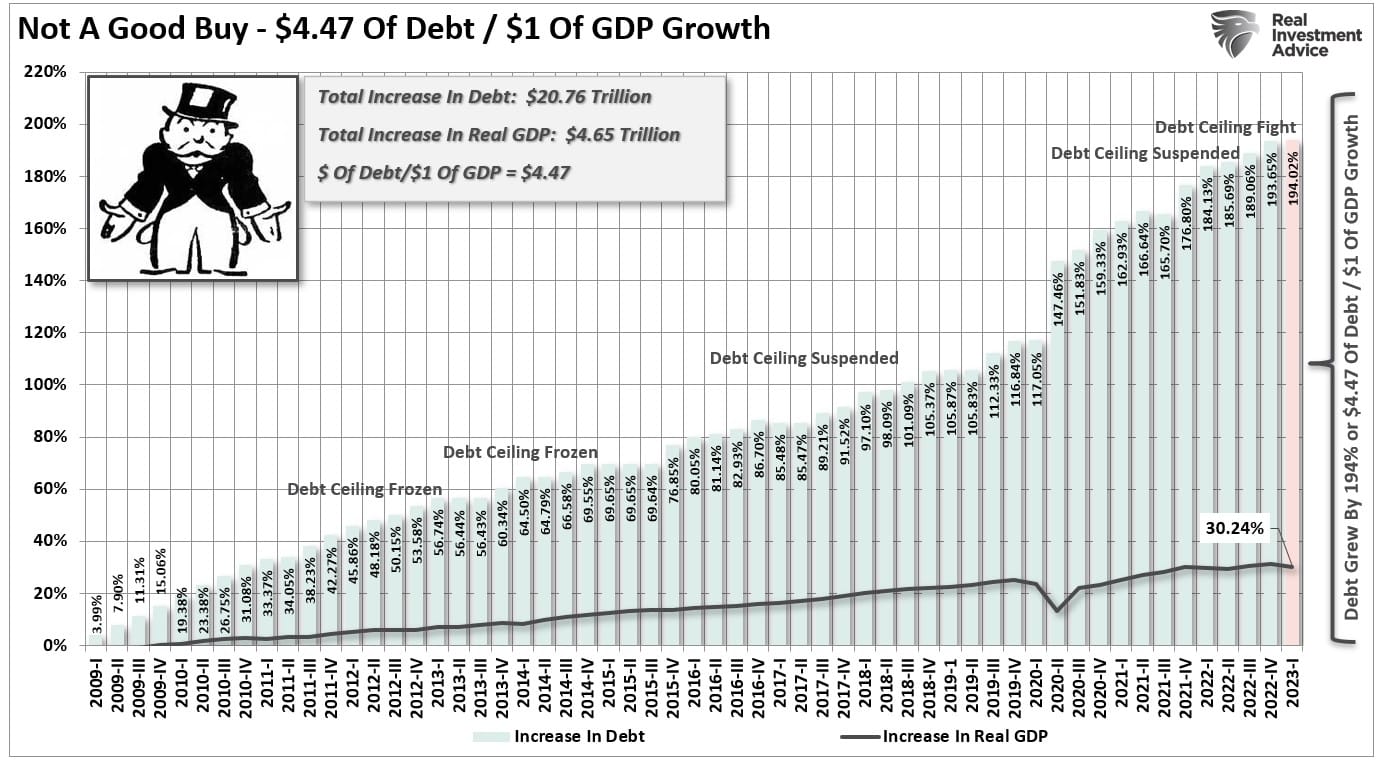
The irony is that debt-driven economic growth consistently requires more debt to fund a diminishing rate of return on future growth. It now requires $4.47 of debt to create $1 of real economic growth.
However, it isn’t just Federal debt that is the problem. It is all debt.
When it comes to households, they are responsible for roughly 2/3rds of economic growth through personal consumption expenditures. Debt was used to sustain a standard of living well beyond what income and wage growth could support. This worked out as long as the ability to leverage indebtedness was an option. Eventually, debt reaches levels where economically productive consumption is eroded.
For the 30 years from 1952 to 1982, debt-free economic growth was running a surplus. However, since the early 80’s, total credit market debt growth has sharply eclipsed economic growth. There is currently an accumulated economic deficit of more than $74 Trillion.
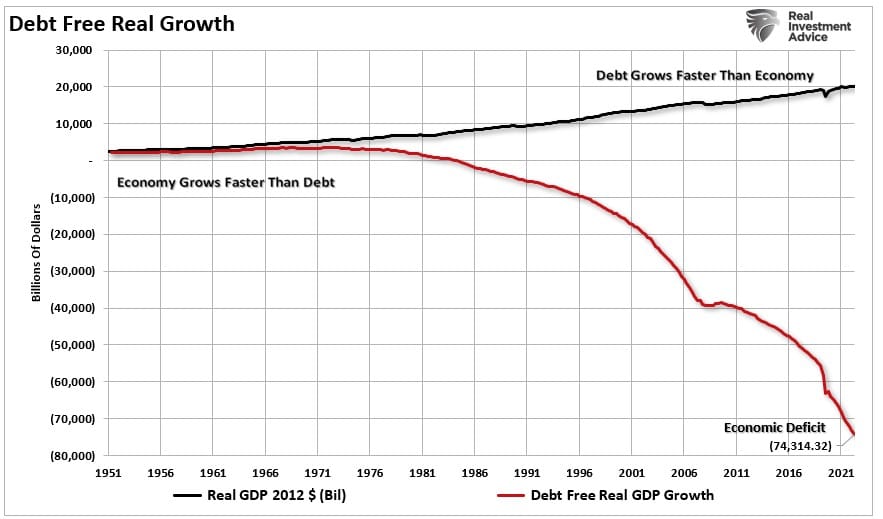
When put into perspective, one can begin to understand the more significant problem plaguing economic growth.
The Debt End Game
Unsurprisingly, Keynesian policies have failed to stimulate broad-based economic growth. Those fiscal and monetary policies, from TARP to QE, to tax cuts, only delayed the eventual clearing process. Unfortunately, the delay only created a bigger problem for the future. As noted by Zerohedge:
“The IIF pointed out the obvious, namely that lower borrowing costs thanks to central banks’ monetary easing had encouraged countries to take on new debt. Amusingly, by doing so, this makes rising rates even more impossible as the world’s can barely support 100% debt of GDP, let alone 3x that.”
Ultimately, the clearing process will be very substantial. A reversion to a structurally manageable debt level would require a nearly $50 Trillion reduction from current levels.
That is the “great reset” many have predicted to be the “end game.”
The economic drag from such a debt reduction would be a devastating process. The last time such a reversion occurred, the period was known as the “Great Depression.”
This is one of the primary reasons why economic growth will continue to run at lower levels. Such suggests we will witness an economy:
- Subject to more frequent recessionary spats,
- Lower equity market returns, and
- A stagflationary environment as wage growth remains suppressed while the cost of living rises.
Changes in structural employment, demographics, and deflationary pressures derived from changes in productivity will magnify these problems.
Correlation or causation? You decide, but $32 Trillion likely matters more than you think.
Related: “Beating Estimates” – How Companies Win in Earnings Season