
Trending

“The ‘Buffett Indicator’ says the stock market will crash.“ Such was an email I received recently and was worthy of a more detailed discussion. Let me begin with my favorite line from “The Princess Bride.”
“I do not think it means what you think it means.”
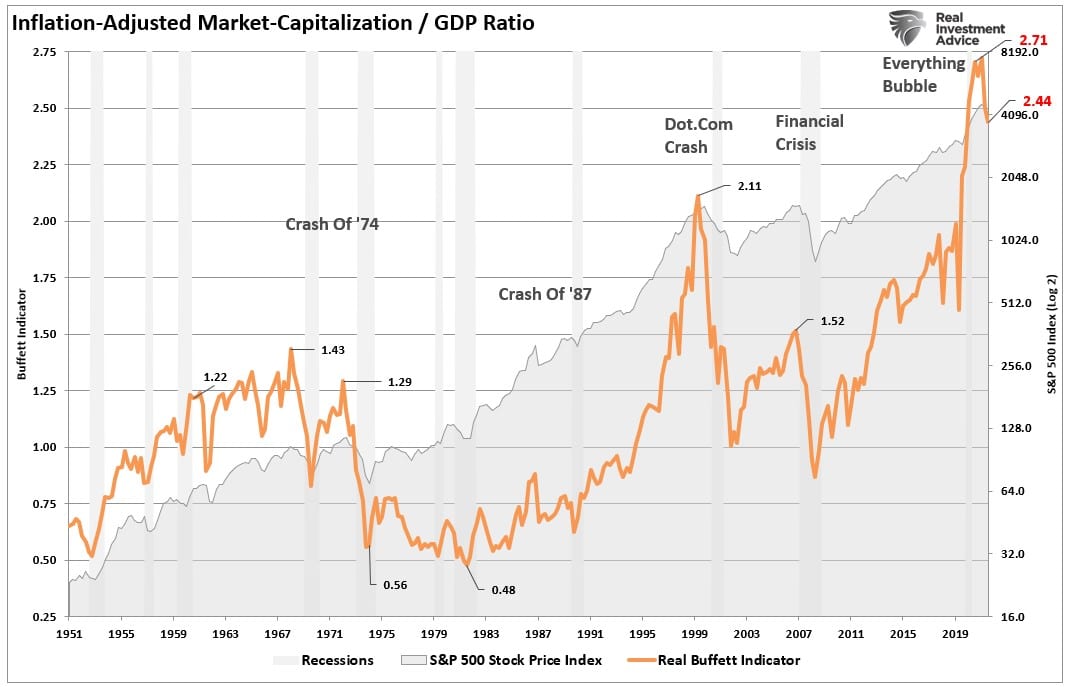
The Buffett Indicator is a valuation measure that compares the stock market’s capitalization to the Gross Domestic Product. A favorite of Warren Buffett, the indicator sits shy of 2.44 times market-cap to GDP. That number doesn’t mean much on its own, but it’s striking when placed in a historical context. Even after the recent fall in markets, the ratio is still one of the highest on record, north of the 2.11 level recorded during the dot-com bubble of 2000, and considerably elevated compared to the average since 1950.
Since 2009, repeated monetary interventions and zero interest rate policies have led many investors to dismiss any measure of “valuation.” The reasoning is that since there was no immediate correlation, the indicator is wrong.
The problem is that valuation models are not, and were never meant to be, “market timing indicators.” The vast majority of analysts assume that if a measure of valuation (P/E, P/S, P/B, etc.) reaches some specific level, it means that:
- The market is about to crash, and;
- Investors should be in 100% cash.
Such is incorrect. Valuation measures are just that – a measure of current valuation. More importantly, when valuations are excessive, it is a better measure of “investor psychology” and the manifestation of the “greater fool theory.”
What valuations do provide is a reasonable estimate of long-term investment returns. It is logical that if you overpay for a stream of future cash flows today, your future return will be low.
Why The Buffett Indicator Is Valuable
While often overlooked, the Buffett Indicator tells us much as it measures “Market Capitalization” to “GDP.” To understand the relative importance of the measure, we must understand the economic cycle.
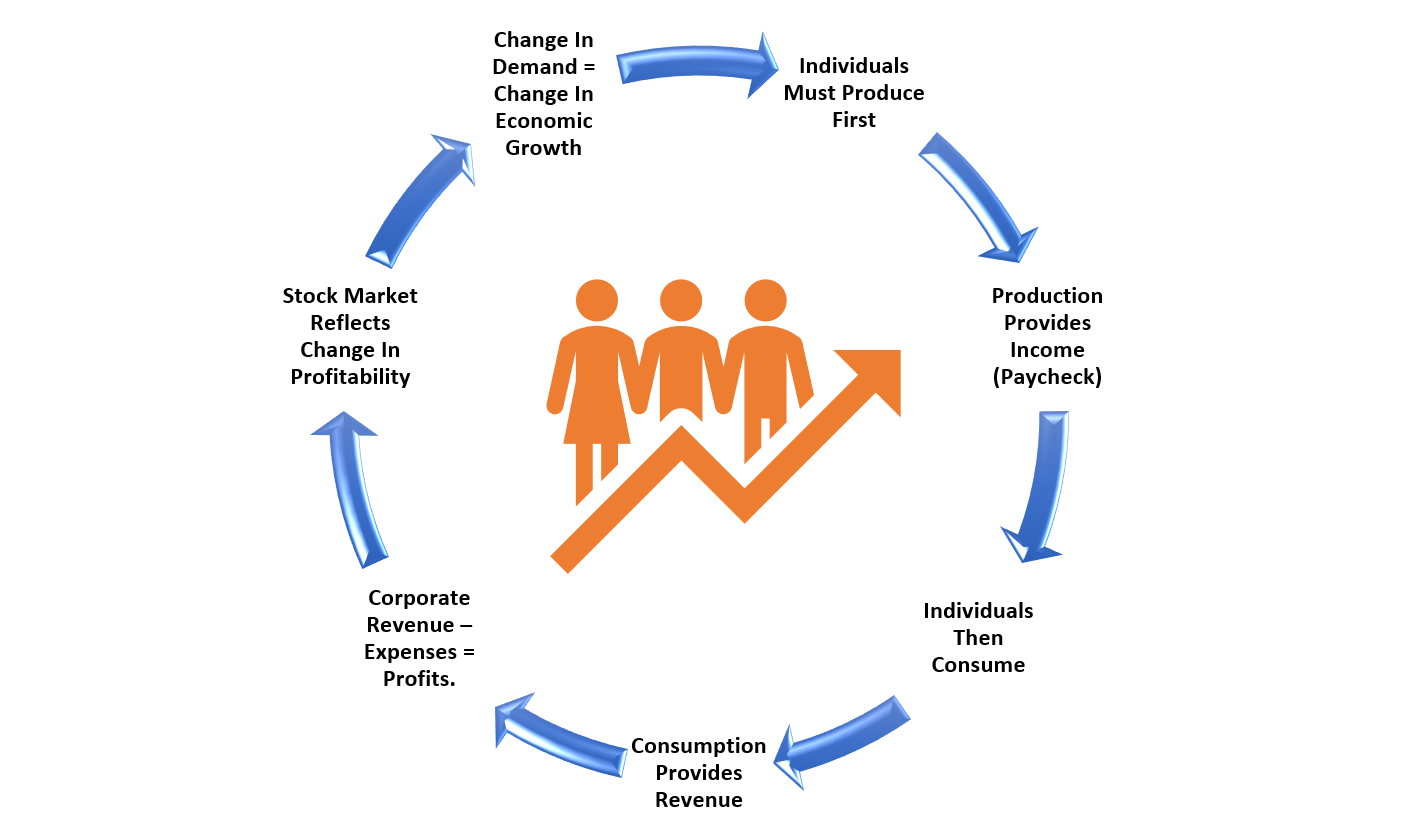
The premise is that in an economy driven roughly 70% by consumption, individuals must produce to have a paycheck to consume. That consumption is where corporations derive their revenues and, ultimately, profits. If something occurs, which leads to less production, the entire cycle reverses, leading to an economic contraction.
The example is simplistic, as many factors impact the economy and markets short term. However, economic growth and corporate earnings have a long-term historical correlation. Therefore, while it is possible for earnings to grow faster than the economy at times, i.e., post-recession, they can not outgrow the economy indefinitely.
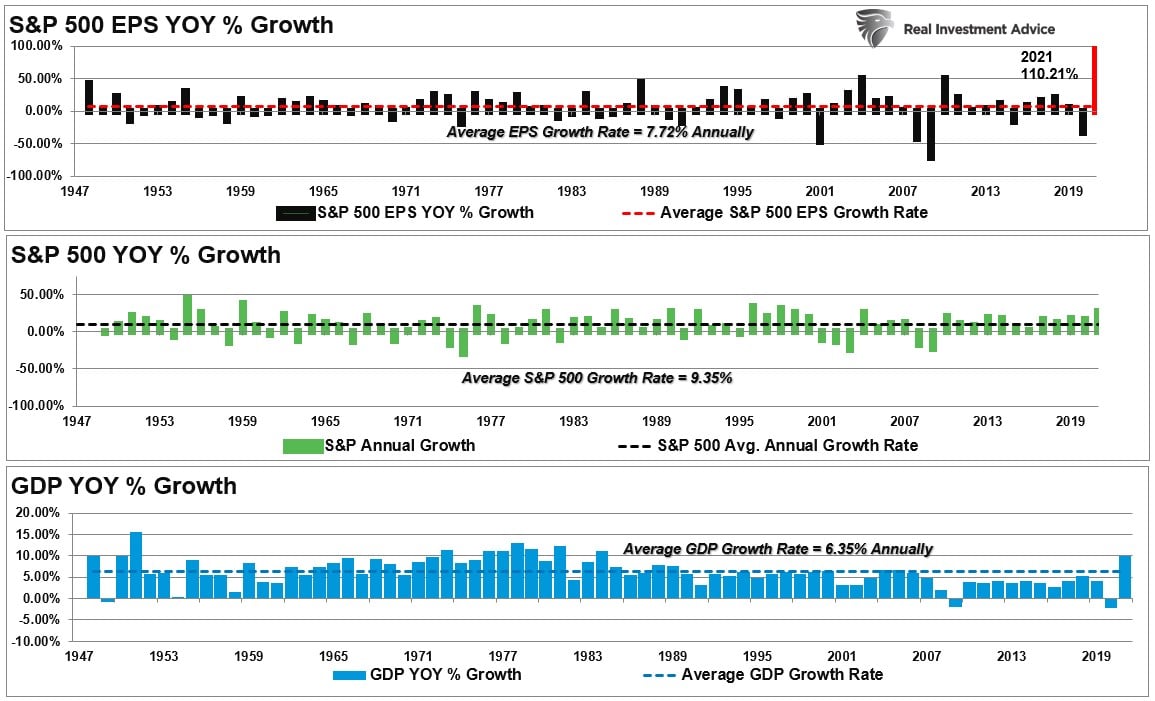
Since 1947, earnings per share have grown at 7.72% annually, while the economy has expanded by 6.35% annually. Again, the close relationship in growth rates should be logical. Such is particularly the case given the significant role spending has in the GDP equation.
Therefore, the Buffett Indicator tells us that overvaluation is not sustainable when the market capitalization of stocks grows faster than what economic growth can support. Therefore, a market capitalization ratio (the price investors are willing to pay times the total number of shares outstanding) greater than 1.0 is overvalued, and below 1.0 is undervalued. Today, investors are paying almost 2.5x what the economy can generate in revenues and earnings.
Does that excess valuation mean the stock market is going to crash? No.
However, there are significant implications that investors should consider.
Valuations & Forward Returns
As is always the case, while valuations are a terrible “market timing” indicator, they are an excellent predictor of future returns. I previously quoted Cliff Asness on this issue in particular:
“Ten-year forward average returns fall nearly monotonically as starting Shiller P/E’s increase. Also, as starting Shiller P/E’s go up, worst cases get worse and best cases get weaker.
If today’s Shiller P/E is 22.2, and your long-term plan calls for a 10% nominal (or with today’s inflation about 7-8% real) return on the stock market, you are basically rooting for the absolute best case in history to play out again, and rooting for something drastically above the average case from these valuations.”
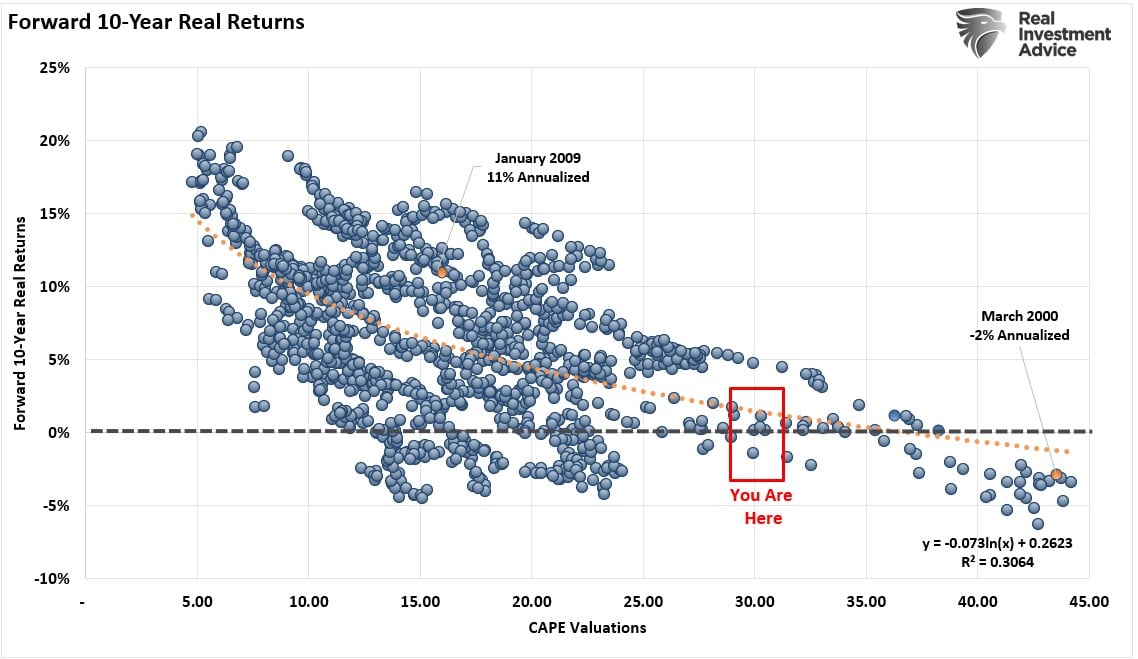
We can prove that by looking at forward 10-year total returns versus various levels of PE ratios historically.
Asness continues:
“It [Shiller’s CAPE] has very limited use for market timing (certainly on its own) and there is still great variability around its predictions over even decades. But, if you don’t lower your expectations when Shiller P/E’s are high without a good reason — and in my view, the critics have not provided a good reason this time around — I think you are making a mistake.”
And since we are discussing Mr. Buffett, let me remind you of one of Warren’s more insightful quotes:
“Price is what you pay, value is what you get.”
The “Buffett Indicator” confirms Mr. Asness’ point. The chart below uses the Willshire 5000 Market Capitalization versus GDP and is calculated on quarterly data.
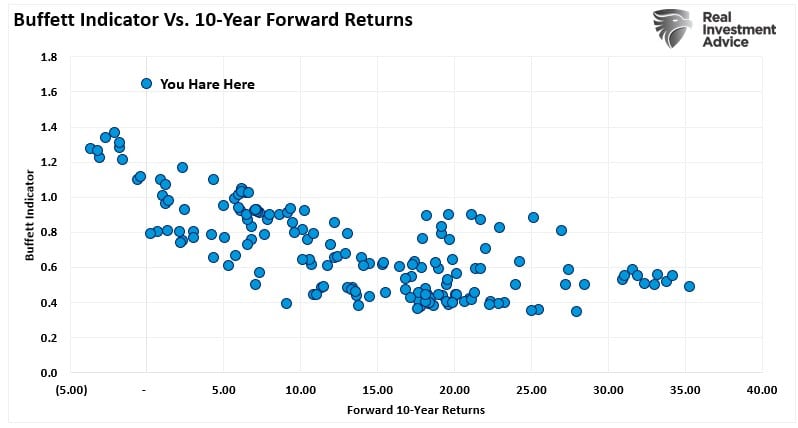
Not surprisingly, like every other valuation measure, forward return expectations are substantially lower over the next ten years than in the past.
Fundamentals Don’t Matter Until They Do
In the “heat of the moment,” fundamentals don’t matter. As stated, they are poor timing indicators.
In a market where momentum is driving participants due to the “Fear Of Missing Out (FOMO),” fundamentals are displaced by emotional biases. Such is the nature of market cycles and one of the primary ingredients necessary to create the proper environment for an eventual reversion.
Notice, I said eventually.
As David Einhorn once stated:
“The bulls explain that traditional valuation metrics no longer apply to certain stocks. The longs are confident that everyone else who holds these stocks understands the dynamic and won’t sell either. With holders reluctant to sell, the stocks can only go up – seemingly to infinity and beyond. We have seen this before.
There was no catalyst that we know of that burst the dot-com bubble in March 2000, and we don’t have a particular catalyst in mind here. That said, the top will be the top, and it’s hard to predict when it will happen.”
Furthermore, as James Montier previously stated:
“Current arguments as to why this time is different are cloaked in the economics of secular stagnation and standard finance workhorses like the equity risk premium model. Whilst these may lend a veneer of respectability to those dangerous words, taking arguments at face value without considering the evidence seems to me, at least, to be a common link with previous bubbles.“
Stocks are far from cheap. Based on Buffett’s preferred valuation model and historical data, return expectations for the next ten years are as likely to be negative as they were for the ten years following the late ’90s.
Investors would do well to remember the words of the then-chairman of the SEC, Arthur Levitt. In a 1998 speech entitled “The Numbers Game” he stated:
“While the temptations are great, and the pressures strong, illusions in numbers are only that—ephemeral, and ultimately self-destructive.”
Regardless, there is a straightforward truth.
“The stock market is NOT the economy. But the economy is a reflection of the very thing that supports higher asset prices: earnings.”
No, the Buffett Indicator doesn’t mean markets will definitely crash. However, there is a more than reasonable expectation of disappointment in future market returns.
Related: Asset Bubbles & Forward Returns