Written by: Jacob Johnston | Advisor Asset Management
Negative returns and high volatility have been a wake-up call of sorts to investors who have become accustomed to the exceptional run of performance that we have witnessed over recent years. The reality of surging inflation coupled with slowing economic growth has started to settle in — trends that have accelerated in recent weeks as the implications of war in Ukraine begin to take shape. The S&P 500 began 2022 very close to an all-time high but has dropped over 10% into correction territory through the first week of March. Equity returns underneath the broad index level, however, have diverged in key areas. We examine three factors that show similar trends and offer potential ways to navigate the volatility.
Factor 1: Valuations
Equity valuations and inflation, as measured by the Consumer Price Index (CPI), have historically been inversely related as seen in the table and chart below. As CPI goes up, price-to-earnings ratios (PE) go down.
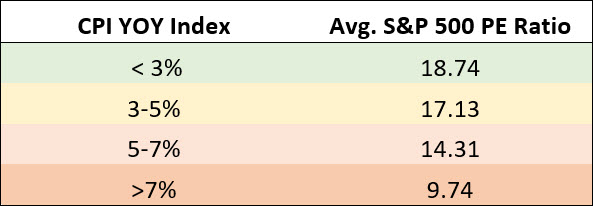
Source: AAM, Bloomberg. 1954-2022, Monthly Data | Past performance is not indicative of future results. YOY = year over year
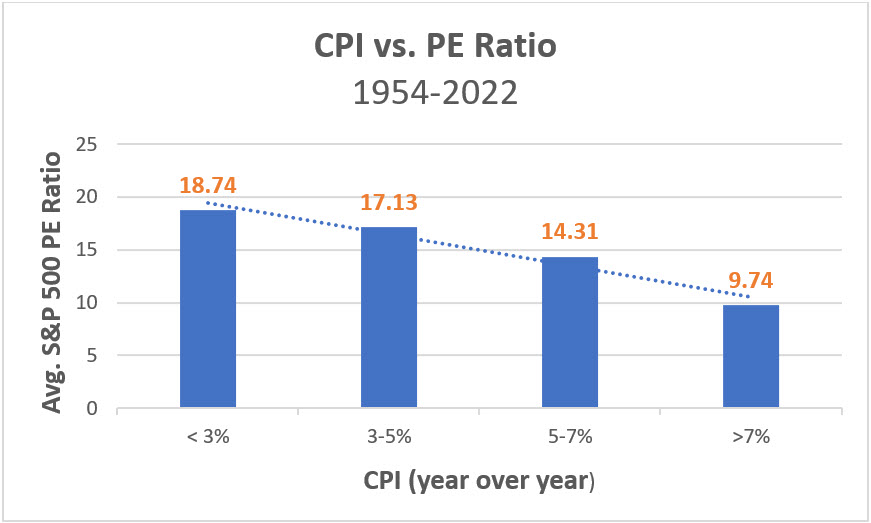
Source: AAM, Bloomberg. 1954-2022, Monthly Data | Past performance is not indicative of future results.
This relationship has stayed true over the last 12 months. CPI jumped from 1.7% (year-over-year) in February 2021 to 7.9% in February 2022 — a 40-year high. The trailing price-to-earnings ratio of the S&P 500 dropped from 30.95 to 22.47 over the same period — a 27% reduction. This “repricing,” or multiple contraction, has been channeled by stocks with the highest valuations which have come under the most pressure year-to-date (YTD), while stocks with lower valuations have held up much better. If we divide the S&P 500 into groups by PE ratio, the lowest valuation quintile was still in positive territory through February while the highest valuation quintile was down 14.41%, a difference of over 16%.
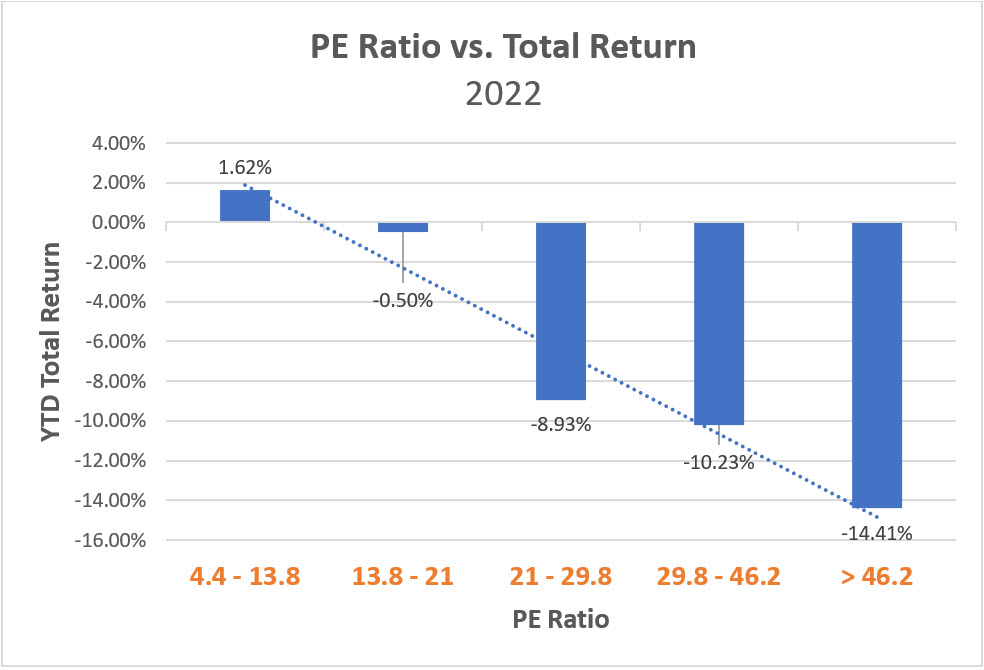
Source: AAM, FactSet. As of 2/28/22 | Past performance is not indicative of future results.
Factor 2: Dividend Yield
There is a similar trend when dividing the S&P 500 into groups based on dividend yield where stocks with no dividend have come under the most pressure year-to-date, while dividend-paying stocks have held up better. The higher the dividend yield the higher the performance has been with the highest yielding quintile still in positive territory, up 4.68% through February, compared to non-dividend payers which are down 13.31%, a difference of over 18%.
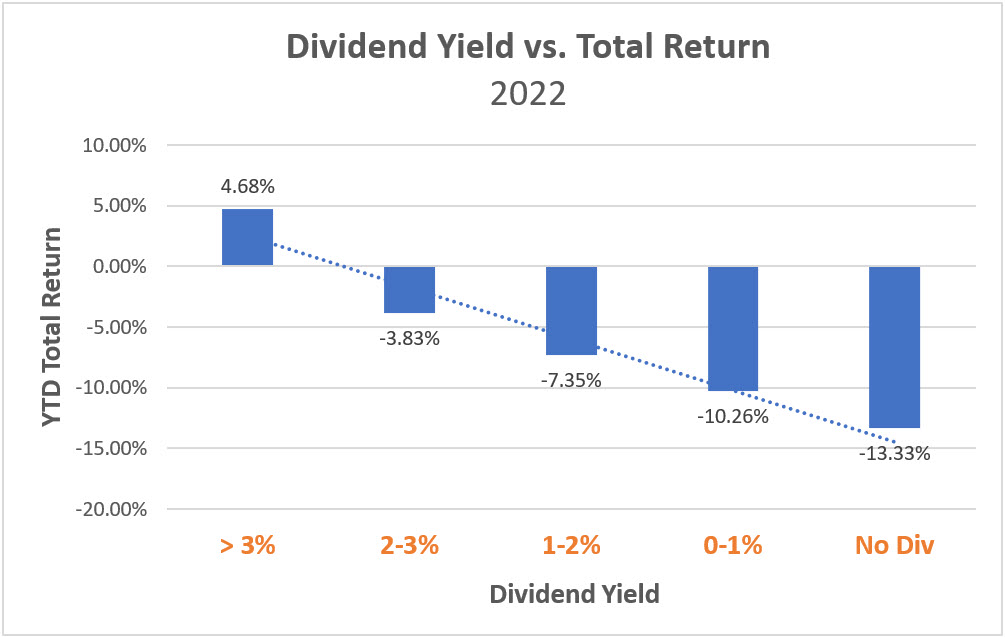
Source: AAM, FactSet. As of 2/28/22 | Past performance is not indicative of future results.
Factor 3: Free Cash Flow Yield
Lastly, there is a similar trend when dividing the S&P 500 into groups based on free cash flow yield. Stocks with low or negative free cash flow yield have come under the most pressure, while stocks with high free cash flow yield have held up much better — the higher the free cash flow yield the higher the performance. The highest yielding quintile is still in positive territory, up 2.67% year-to-date compared to the lowest yielding quintile which is down 18.22%, a difference of over 20%.
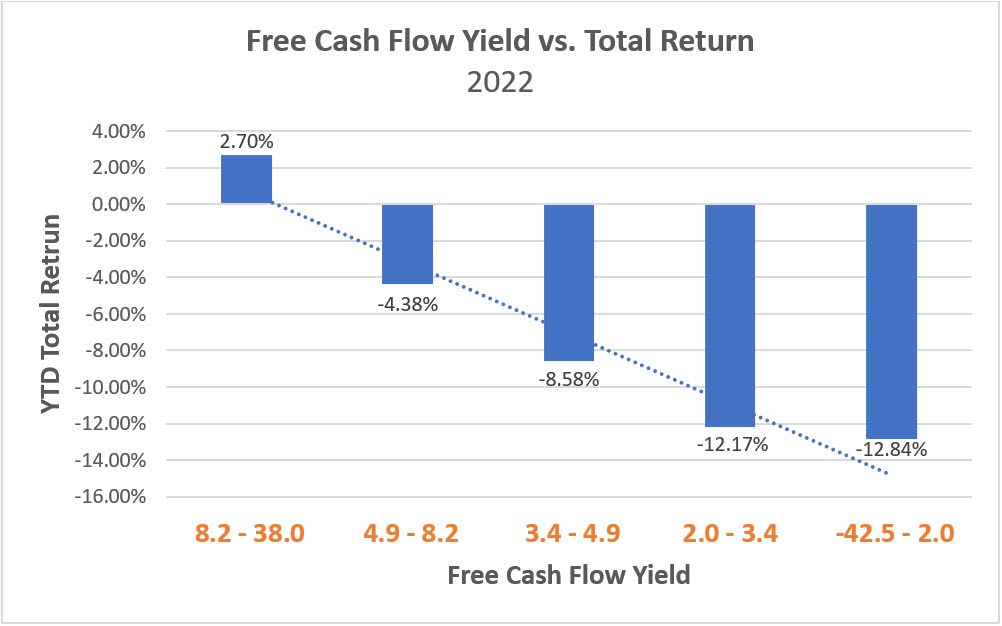
Source: AAM, FactSet. As of 2/28/22 | Past performance is not indicative of future results.
High inflation and slower growth make for a challenging equity market. We expect valuations to remain under pressure and volatility to persist in these conditions. Equity investors may be able to navigate this period by gaining exposure to stocks with low valuations, high dividend streams, and high free cash flow which have proven resilient so far in 2022.