
Something that's being brought time and again this year is that domestic stocks are expensive, but not exorbitantly so.
The S&P 500 trades at 25.21x earnings and 17.74x cash flow. High multiples to be sure, but nothing to get worked up about. At least not yet. Plus, advisors know valuation alone isn't a reason to buy or sell a security. Even technology, often home to high valuations, isn't all that expensive relative to historical norms.
Those data points are encouraging for those like deals or the perception of good value. Hey, it's holiday shopping season so everyone's looking for a good deal. Still, valuing equities is a fluid endeavor.
“There are many ways to value the stock market like market capitalization-to-GDP, price-to-sales, Shiller price-to-earnings, and other ratios,” ponders Nicolas Rabener of FactorResearch. “We are going to focus on the simple price-to-earnings (“P/E”). However, this is more complicated than perhaps assumed. Should we take the current or forward P/E ratio? If forward, how far out do we want to go?”
Answers In Equal-Weight
A prime avenue for advisors to turn to amid all this valuation chatter is the equal-weight methodology – one that's easily conveyed to clients. Consider the S&P 500® Equal Weight Index – the equal-weight offshoot of the cap-weighted S&P 500.
The equal-weight S&P 500 has a lengthy history of outperforming its cap-weighted counterpart and whether its critique or compliment, market observers often attribute that out-performance to the value and size factors. In particular, the equal-weight's value tendencies are relevant today.
“However, there is a significant difference between calculating P/E ratios using the market capitalization of stocks as weights, or equal-weighting stocks,” adds Rabener. “Furthermore, there is a difference whether using the average or median for equal weight. The largest companies within the S&P 500 are trading at more expensive valuations than smaller companies, which is reflected in the P/E multiple being the highest when using market capitalization as a weighting scheme.”
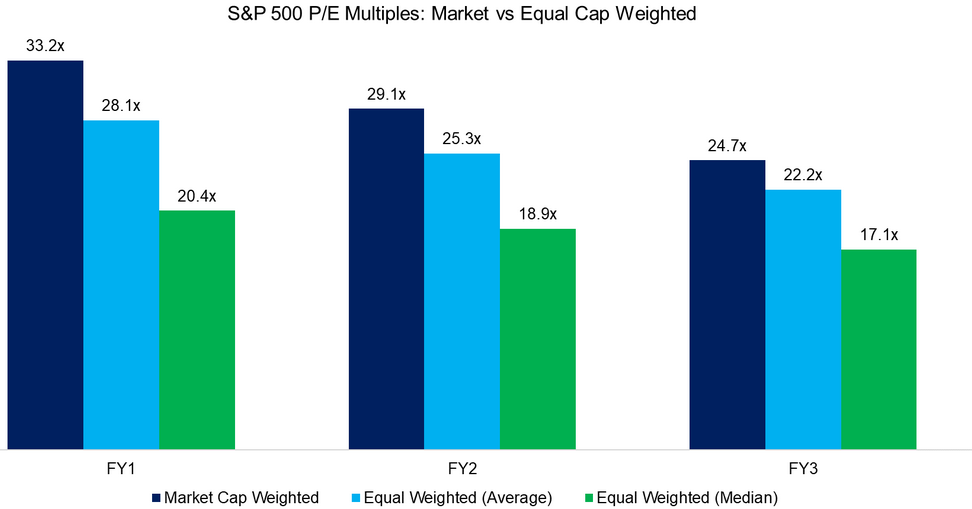
Courtesy: Factor Research
For now, investors might be inclined to ignore the above chart and aforementioned wisdom about the advantages of equal weighting because S&P 500 earnings growth is strong this year. Strong enough to, in many cases, support the frothy multiples on some of the index's largest components. That, however, won't last.
“The outlook for EPS growth of the S&P 500 is rosy with consistent growth. Unfortunately, these forecasts are almost certain to be incorrect as analysts tend to be overly optimistic given conflicts of interests (corporate management does not appreciate Sell recommendations and there are more buyers than sellers of stocks),” notes Rabener.
Interestingly, median S&P 500 Equal-Weight Index earnings growth over various time horizons exceeds that of the cap-weighted benchmark.
It Takes Awhile
It's wonky, but interesting statistic, but the amount of time it takes a company to deliver in earnings per share an investor's initial stake can be reflective or lack there. As Rabener points out, it would take Tesla (NASDAQ:TSLA) 170 years to earn an investor's initial stake allocated today.
“However, when considering the valuation of the S&P 500 investors should avoid focusing too much on a single stock, although it is worth highlighting that the top 10 stocks by market capitalization contribute 30% of the S&P 500, which is a record high,” he says. “Almost all of these exceptionally successful companies are expected to grow their earnings significantly, which is not an easy accomplishment given the sheer magnitude of profits. Apple, Microsoft, and Alphabet are approaching $100 billion of earnings, also a record for listed companies.”
Indeed, plenty of tech stocks are expensive today and some have the earnings growth to merit those multiples, but if it's a good deal a client is after while avoiding performance chasing and concentration risk, equal-weight makes a lot of sense.