
Trending

Written by: Riz Hussain and Christopher Gizzo, CFA | Lord Abbett
As several crosscurrents swirl about the fixed-income market—including the potential for the U.S. Federal Reserve (Fed) to wind down its campaign of interest-rate hikes, the historic levels of inversion of the U.S. Treasury curve, and uncertainty about the trajectory of U.S. economic growth—Lord Abbett investment professionals have identified some intriguing opportunities across the yield curve and within credit. Christopher Gizzo, Partner, Deputy Director of Leveraged Credit, and Riz Hussain, Investment Strategist, Leveraged Credit, recently participated in a session with investors to discuss the factors currently lending appeal to short duration high yield bonds. Edited excerpts of their presentation follow.
1. Yield Relative to Longer-Duration High Yield
To start, let’s look at the current setup for the short-duration, high-yield markets. Figure 1 shows a very simple time series of the difference in the yield to worst of the short-duration, high-yield credit market versus the longer-duration, full high-yield market, both centered on the ‘BB’- and ‘B’-rated part of high yield. Basically, we are looking at the higher-quality part of the high-yield market and yields on shorter-duration bonds versus their longer-duration counterparts. What’s interesting here is that you see a rare, and typically short-lived phenomenon: the yield on short-duration, higher-quality, high yield bonds is actually higher than that of normal duration high yield overall.
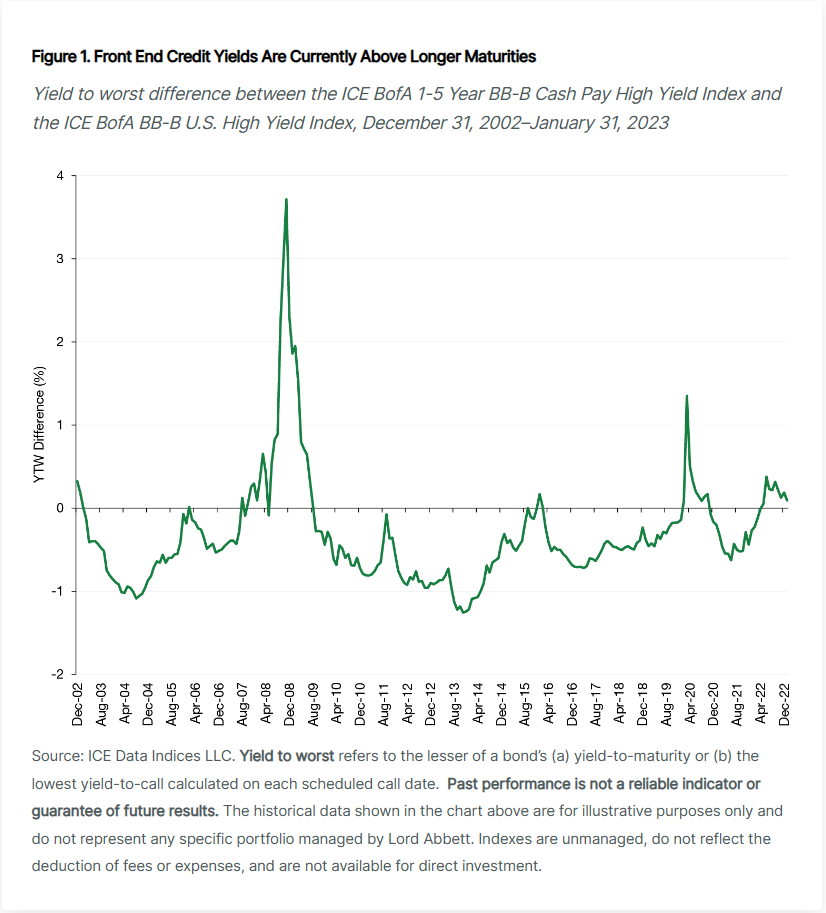
If you look at periods covered by the 2008–09 global financial crisis (GFC) and the market volatility in early 2020 sparked by the onset of the COVID-19 pandemic, the real drive in the spike in the yields on the front end was driven by credit spreads widening sharply, an indication of concern around distress in the credit markets. Today you have a very different situation, with an inverted yield curve—where short-term benchmark rates exceed long-term rates--presenting a yield opportunity on the short end, while credit spreads themselves have been well-behaved, signaling relatively low concern about corporate balance sheets coming under stress in the near term.
2. Yield Relative to Equity Earnings Yield
Figure 2 shows the yield-to-worst of the short-duration, higher-quality segment of the high yield market, divided by the earnings yield of the broad equity market benchmark, the S&P 500® Index. (Earnings yield is earnings per share divided by the share price, the reciprocal of the P/E [price-to-earnings] ratio; when this comparison is quoted as a multiple, it can be used to compare yields in the equity and fixed income markets.)
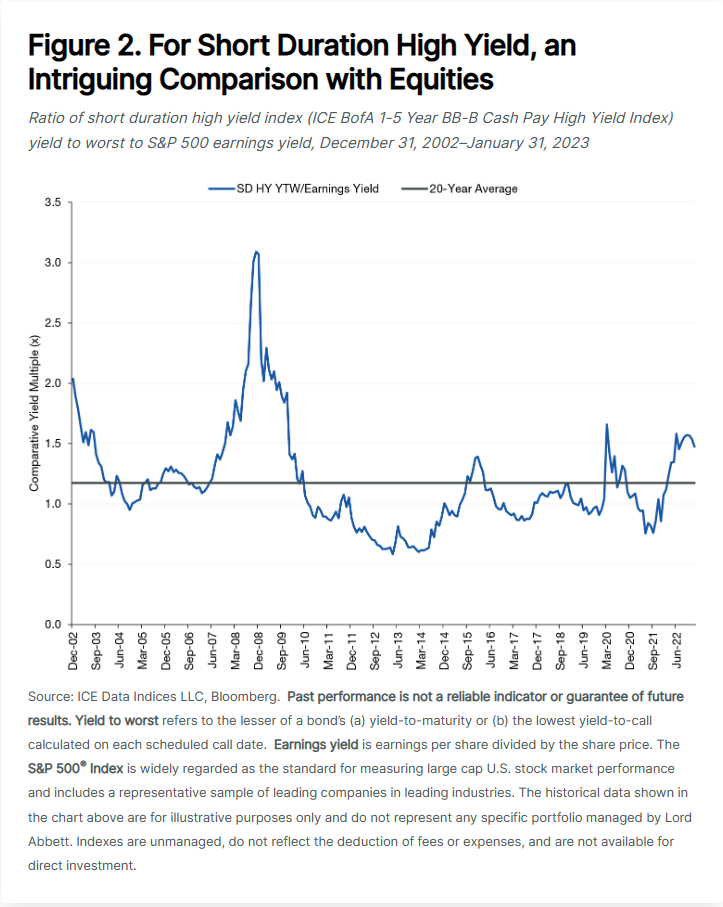
A couple of things jump out here. First, you can see that ratio today is reasonably elevated versus history. There was a big upward move in this ratio during the GFC, and again during the pandemic. But what's notable here is that when you look at today’s comparative yield ratio in these asset classes, this doesn't persist for very long periods of time.
How might this be resolved? Historically, it means that yields in credit move lower as bond prices climb, and sometimes that's driven by either a normalization of the yield curve or a tightening of credit spreads. Or the earnings yield in the equity market could increase, either through earnings growth or share-price declines.
So, without taking a specific view on all segments of the equity market, we think there is potentially a compelling headline relative value opportunity between the credit markets and the equity markets. The opportunity for equity-like returns in credit markets seems very viable.
3. More Attractive Risk-Adjusted Returns
Let’s switch our focus back to high yield on its own. We have an interesting observation about Sharpe ratios, a widely used measure of risk-adjusted returns. Figure 3 shows the Sharpe ratios of the ‘BB’ and ‘B’ parts of the high-yield market for the 0-3 year, 3-5 year, and 5-year plus maturities within those rating categories.
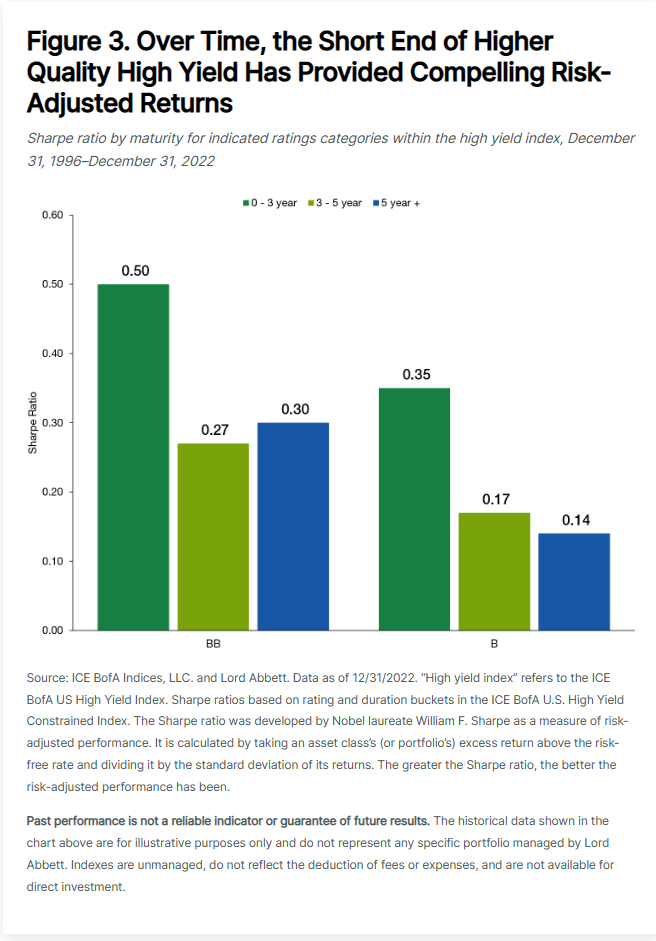
What you find here is that despite the notion that short-duration debt may not necessarily present attractive total absolute returns, data show that within higher-quality high yield, shorter-maturity issues have posted higher Sharpe ratios than their intermediate- and longer-maturity counterparts.
4. Same Spreads, Lower Risk
There’s another dimension to the short-duration high yield story, as shown in Figure 4. What you see in the left panel is that the shape of the spread curve, both in ‘BB’ and ‘B’ bonds, over the various maturity categories, is rather flat.
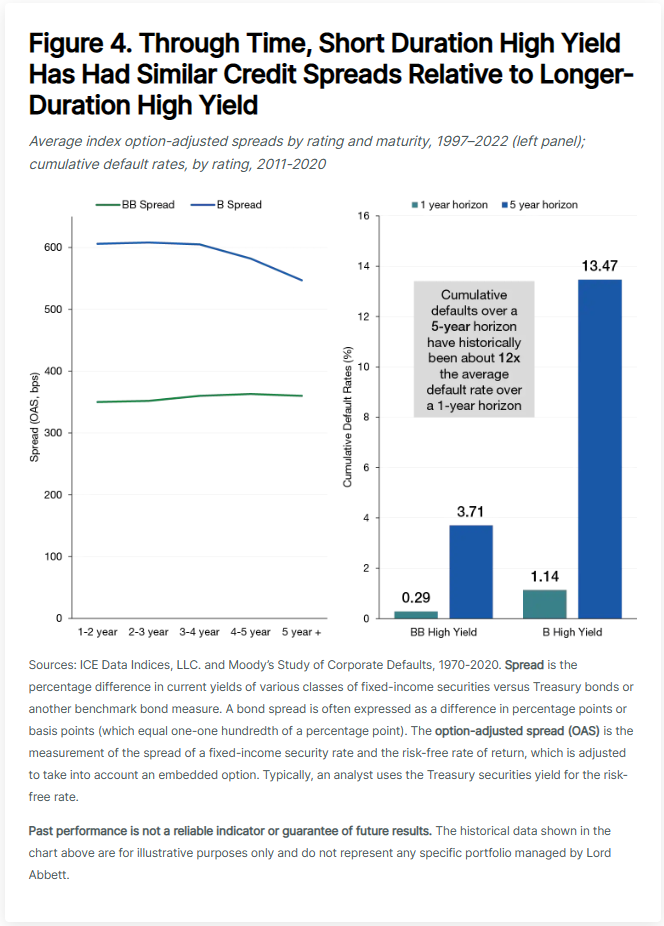
Put another way, averaged through time, spreads in the front end of the curve are largely the same as those you get in longer-duration credit, in both ‘BB’s and ‘B’s. This is noteworthy because if you look at the right panel of Figure 4, you will see that default rates grow, albeit in a non-linear fashion, when you hold credit for a longer time frame. That makes some intuitive sense. Typically, there aren't a lot of things that can go wrong with a company over a one-, two-, or even three-year period. But then, the longer you hold onto credit, there's the higher potential for three outcomes: the company gets upgraded to investment grade, has its rating cut to a lower tier of speculative grade, or defaults. These trends illustrate another attractive characteristic of short duration high yield in the current environment, with a similar level of default risk priced into front end spreads as those spreads move further out the maturity curve.
5. Solid Fundamentals
Finally, let’s take a step back to examine the fundamentals of the broader high yield market. Figure 5 presents a couple of data series that show the high yield space at a strong point. The left panel shows the overall leverage ratio—debt divided by EBITDA (earnings before interest, taxes, depreciation, and amortization)—for the broad high yield market since 2008. And you see just how much it's recovered from the impacts of COVID-19, and that the ratio was near historically low levels as we exited 2022. Even if we see a gradual deterioration in this measure during 2023 should economic growth slow, leverage levels would still be historically strong.
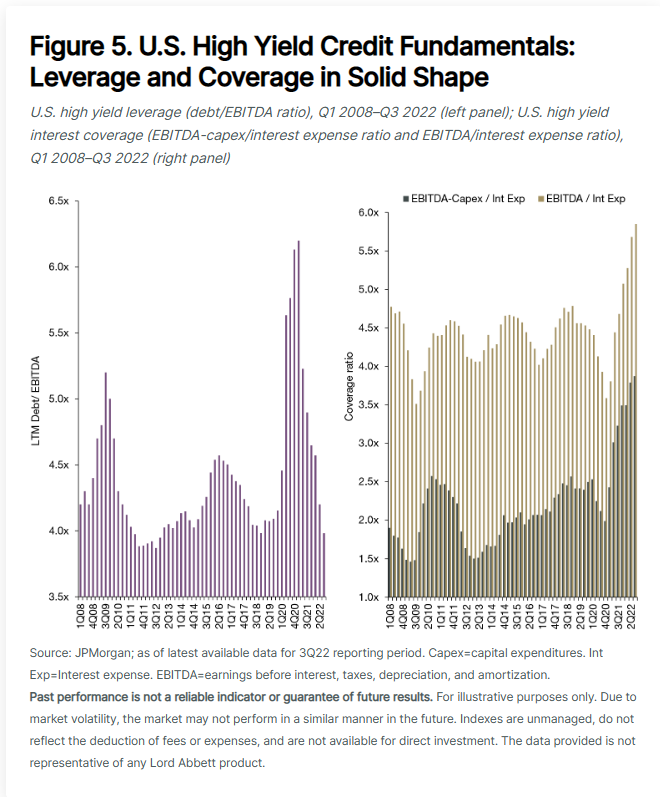
Another important point for high yield is in the right panel, which shows the coverage ratio (EBITDA divided by interest expense), along with another key measure of a company’s ability to service its debt, EBITDA minus capital expenditures divided by interest expense. As it turns out, those companies that issued fixed-rate, and not variable-rate, debt before the recent interest-rate runup are in a very good position, by not having rates, and thus interest costs, move higher when interest rates rise. That's part of the reason why interest coverage ratios are staying so strong--at levels that are the best that we've ever seen in the asset class.
This strength is complemented by another long-term trend we have spotlighted in the past: the credit quality of the benchmark high yield index is near the strongest levels in its history, with ‘BB’-rated bonds comprising over half of the broad high yield index. The strong fundamentals likely helped keep spreads from widening more significantly over the past year, even as recessionary fears climbed. In 2022, the largest spread for the broad high yield index was 600 basis points (bps); in prior periods of pronounced recessionary fears, that level would have widened to as much as 800-1,000 bps.
Summing Up
The main story of last year for credit markets was one of investors displaying increasing defensiveness. And that was due to the ever-growing uncertainty on the growth outlook that we had globally. But to start this year, these concerns have eased, and we've seen multiple signs that are making us more comfortable with the short-term outlook for growth. That, in turn, is giving us some confidence to reach a little bit more for yield by moving modestly lower in credit quality from ‘BB’ bonds into ‘B’ bonds—though not too far into ‘CCC’ territory—given the ongoing uncertainty in the outlooks for growth and rates and their potential impact on the weakest of credits. But we are finding plenty of opportunities in ‘B’-rated bonds, a portion of the market that we think may outperform in the first half of 2023.
The bottom line: You can generate high levels of income within the short-duration, high-yield market with limited duration exposure. And we've found, through conversations with investors about the asset class, that given the uncertainties mentioned earlier, the combination of high income and limited duration exposure continues to be an attractive proposition.