
Trending

Written by: Michael Landrum | AAM
Municipal bonds have been on a tear in 2023. So far, they are outperforming the volatility in the rates markets. Looking at the Bloomberg Municipal Bond Total Return Index as of 2/13, it is up 2.42% year to date. It’s an impressive run for an asset class that rarely shows that type of returns in just over a month. Compared to the 10-year Treasury — which is only up 0.97% on the year — municipal bonds are looking very attractive from a performance standpoint. This is great news for the investor who owns municipal bonds and is watching his prices go up considerably more than usual, but where does this market put the investor who is trying to put money to work in the municipal market and is met with rates inside of 10 years paying less than 60% of comparable Treasuries?
First, we need to examine how we got here and why the municipal market has been outperforming other fixed income asset classes.
The answer is very simple: Rising rates and higher cost of financing have slowly dropped the issuance numbers creating a massive supply shortage as bonds mature or are called away.
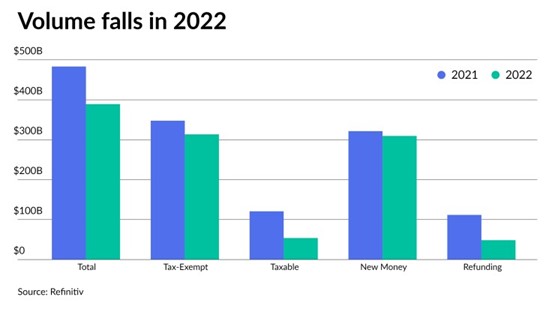
We began to see these effects in 2022 each month as issuance numbers were progressively lower than the previous year. 2022 ended the year with $389 billion in municipal issuance, down 19.5% from the final 2021 number of $483 billion.
Source: Refinitiv / The Bond Buyer
Supply estimates at the beginning of 2022 were as high as $550 billion, so the changing interest rate environment likely influenced municipalities deciding whether to come to market. So far in 2023, only about $30 billion has come to market (at the time of writing this) and even if issuance picks up from here, we are on track for a much lower year on the supply side. The market imbalance becomes even more overwhelming when looking at the net supply numbers. Net supply is the total expected new issue supply over the next 30 days subtracted from the total volume of bond calls and maturing bonds over the following 30-day period. We can reasonably expect that a considerable number of those bonds coming due are owned by asset managers with an investment policy that includes tax-exempt municipal bonds, so a substantial number of those redemptions should come directly back to the municipal market. Net supply has been negative for all of 2023 and topped out late last month with over $18 billion coming due, with no offsetting supply to consume those dollars. The smallest difference between bonds coming due and bonds being issued in 2023 was still significant at -$5.85 billion.
Basically, there is a sustained imbalance between municipal new issue supply and demand for primary and secondary offerings and this has led to a period of outperformance in municipal bonds. At the time of writing, the MMD scale (a generic municipal scale used to price new issues) is yielding less than 60% of comparable Treasuries on all maturities inside of 10 years. There are values to be found on the longer end of the curve for investors, but ultimately, it can be difficult to fill out a proper investment strategy when everything out to 10 years is flying off the shelves. Looking at the “ratio” problem from a historical perspective, it is a common occurrence for the relative value of Munis vs treasuries to deviate from averages. In the past, Muni yields are about 80% of treasuries on average and once we get 1 or 2 standard deviations above or below that percentage, it signals the market to buy or a sell, respectively. The deviation is more pronounced now because there is more cash chasing fewer bonds and the market is ignoring the sell signals.
Now that we understand why the municipal market is outperforming, we must refer to our original question: “Where does this market put the investor who is trying to put money to work in the municipal market?”
The investor who decides to simply wait for supply levels to pick up and ratios to normalize could potentially be waiting a while. Until the fed has control of inflation, we will be in a higher rate environment and issuers will be hesitant to come to market. Generally speaking, “Don’t fight the Fed” has been good advice.
Ultimately, investors who put their cash to work in this market should consider looking at taxable municipals as an option, in our opinion. In the past, a large source of supply for municipal bonds was through bond refunding. These refundings are basically an issuer taking out a longer-term loan to pay off older debt, often at a lower interest rate. In 2017, the Tax Cut and Jobs Act eliminated the ability for issuers to advance refund bonds on a tax-exempt basis. However, the ability to refund tax exempt municipals with a taxable deal is still available and it had been a growing source of issuance over the past few years.
Source Refinitiv / The Bond Buyer
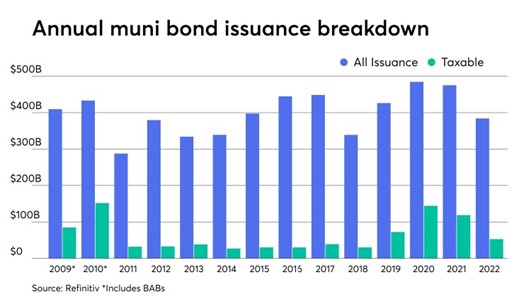
The annual issuance chart above shows a big taxable supply spike in 2019-2022 due to the elimination of exempt refunding in 2017. The last spike in taxable new issue was in 2009-2010 when the Build America Bond program was implemented and up to 35% of coupons were subsidized at a federal level.
Taxable municipals are priced at a spread over the treasury yields, so yields have remained more in line with the rest of the credit market. Taxable municipals also have not seen the overwhelming demand in recent months that the exempt market has been struggling to meet. Additionally, especially for states with a higher tax bracket, while taxable municipals give up the federal tax exemption, many deals retain their state’s tax-exempt status.
Source: Moody’s Investor Service
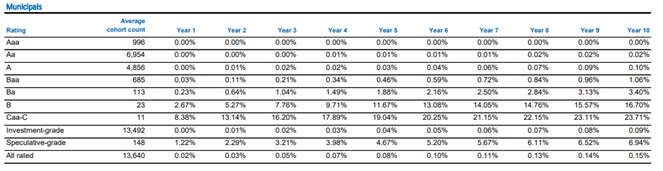
Finally, we will use any chance we get to include the Moody’s cumulative default study. The majority of municipal issuers are A – AAA rated and the cumulative default rates are extraordinarily low in that ratings range (0.1% = 10-year cumulative). Taxable municipals are included in these cumulative default percentages, so investors can find conservatively-rated municipal bond credit quality at significant spreads over treasury. The 10-year AAA Taxable municipal Bloomberg valuation is 70 bps (basis points) over the current 10-year Treasury yield and the 30-year AAA Taxable municipal Bloomberg valuation is 107bps over the current 30-year Treasury.
We fully expect issuance levels to normalize in the next few months and we think we will eventually see opportunities on the exempt side in much greater quantities. However, when prevailing tax-exempt yields are so much lower due to lack of supply, we believe the taxable Muni market is worth diving into for opportunities.
Related: China Is Now Both a Major Headwind and Tailwind for Global Investors