
Trending

Written by: Jess Gaspar and Sara Rosner
As climate change intensifies, so do the physical and transition risks to industries and companies. But how do investors quantify those changes? Historically, they’ve measured a portfolio’s climate impact based on its carbon footprint or weighted average carbon intensity. Today, there are more robust and meaningful approaches—but fundamental insight still holds the key to interpreting the results.
The Financial Impact of Climate Change
At its heart, climate scenario analysis is a risk-planning exercise based on a common behavioral problem: who pays the carbon toll and when? Society could pay today by raising carbon prices, which would lower future demand and potential physical costs—with the trade-off of massive dislocations. Human nature is more inclined to enjoy lower carbon costs today and hope to address extreme physical scenarios in the future.
Both approaches have serious flaws.
The sensible road lies somewhere between the extremes. With the help of climate-change scenario analysis, investors can dispassionately examine the spectrum of potential climate outcomes and the related costs and benefits, assessing the financial impacts of climate change on companies in dollars and cents. While scenario-analysis methods vary, they generally combine scientific climate change models with company-level data.
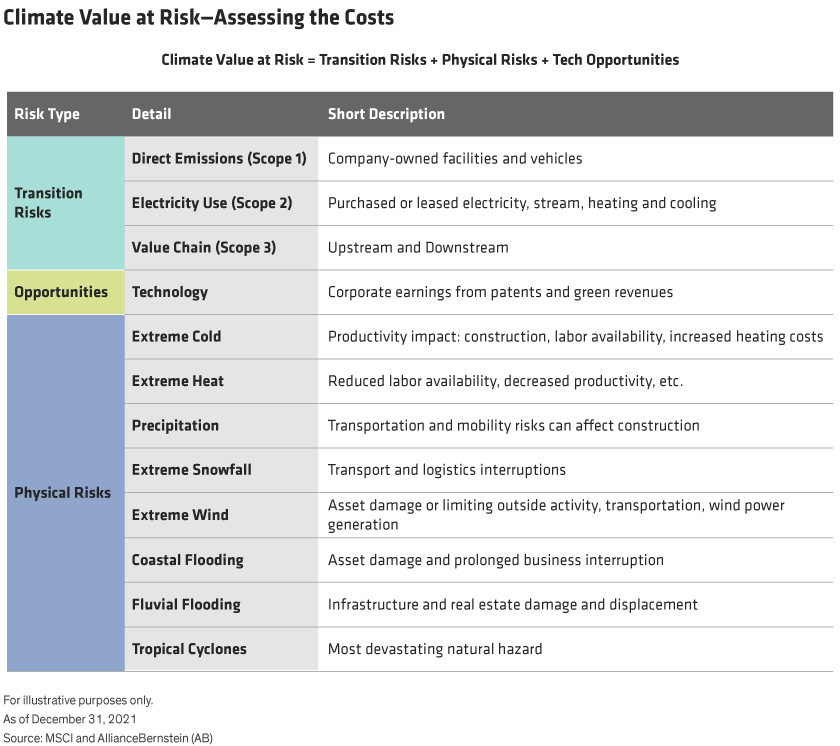
Climate Value at Risk (CVaR)* is the economic value of physical and transition risks plus technological opportunities—one way of measuring the financial impact of climate change. The evolving climate drives physical risks—damaged or stranded assets and business-interruption costs from severe weather events. Transitional risks quantify financial risks to companies as they transition—or don’t transition—to a low-carbon economy, and these risks depend on carbon prices. Climate change opportunities, on the other hand, capture the present value of technological advancements in terms of patents and green revenues.
Selecting a Scenario Analysis Provider: A First Step
In 2019, AB partnered with Columbia University’s Earth Institute to evaluate existing climate scenario analysis providers and their approaches. We judged vendors based on wide-ranging criteria, including the models’ structure and inputs, before selecting one.
But choosing a provider was just a first step: we continue working with the provider to customize the tool for our needs. Our tool includes more than 15 generally accepted scientific models to help value the effects of transition risk on investments; they have different structures, assumptions and inputs and solve for different problems. We only need three models for scenario analysis—but which three? After much discussion with the vendor, we chose models focused on the economic consequences of multiple temperature scenarios over other models that focus on aspects such as land use, energy systems, water demand or other environmental impacts.
Adapting a provider’s tool doesn’t end the story, either. To fully integrate the results of climate scenario analysis, we need to apply fundamental analysis and insight to understand the model’s idiosyncrasies and interpret the results—in a world where data inputs will be incomplete and imperfect.
Interpreting the Nuances in Climate Models
Models can be effective tools, but an analyst’s fundamental research and expertise are vital to interpreting the results and nuances. For example, model outputs can change a lot depending on what actions a company takes—or doesn’t take. If a firm puts off reducing its carbon footprint, its transition risk will grow as carbon prices continue to rise globally, even if nothing else changes. The longer a company waits to take action, the greater the cost and dislocation (Display).
A model may produce a high physical risk score, indicating that a company’s operations face disruption from climate change. As an example, let’s assume that most of a retailer’s locations are in the US northeast corridor, but it sells products that are manufactured overseas. The business may be affected by risks such as extreme snowfall, which can delay the movement of goods from ports to stores and boost transport costs, leading to lost sales and lower margins.
A perfectly built model with flawless data would incorporate all current and future locations of a company, its suppliers and its customers. But granular data at that level aren’t always available, and even if they are, analysis providers may interpret the data differently. For example, one provider calculates a company’s physical risk based solely on its headquarters location, despite its global supply chain stretching across far-flung manufacturing locations. Industry and company insights from fundamental investment research are needed to identify and account for these quirks and limitations.
Physical risk is also a moving target as companies evolve. Firms may move office locations and facilities over the years, and the geographic span of their customers can change too. As companies across the world attempt to unsnarl pandemic-tangled supply chains, it’s a timely reminder that companies may consider shifting production facilities closer to customers. Should companies begin to shrink supply chains, investors need to understand how scenario analysis models should reflect this change.
Under CVaR, climate change opportunity scores are derived from patents and green revenue—generated by sources like solar-generated electricity. Holding a patent today can be a plus, but it doesn’t always indicate future profits. Expectations of future patent revenues are estimates, but actual green sales are easy to calculate. It’s vital to understand whether a company’s scores reflect the model’s focus on innovation—patents—rather than execution. In our view, green revenues should play an expanded role: in the 1849 gold rush, selling picks and denim jeans to miners was more lucrative than owning a claim and mining for gold.
Even Imperfect Data Offer Useful Information
Data that feed CVaR calculations are wide-ranging, often unstructured and from multiple sources. These inputs are far from perfect but can still be helpful—if investors understand where the hazards may lurk. For example, CVaR gauges transition risk from carbon output viewed through the three emissions scopes.
Scope 1 includes carbon created by company-owned facilities and vehicles, while Scope 2applies to bought or leased electricity as well as heating and cooling. Scopes 1 and 2 are reported similarly by most climate-scenario model providers. But Scope 3, which includes carbon emissions both upstream and downstream from a company, must be better defined—an industry-wide challenge. Scope 3 emissions numbers can vary wildly, even among firms with similar business models.
We expect stakeholders to eventually come together on Scope 3 reporting, but in the meantime, models take data at face value. Some variables are exponential, so measurement error is high, and portfolio tail risks can skew heavily negative. Despite these caveats, the estimates are still useful.
Rather than giving up on modeling because the data aren’t perfect, we believe that marrying fundamental and quantitative analysis will better enable investors to translate climate information into insights. Returning to the emissions discussion, a well-versed fundamental analyst knows when a company’s Scope 3 emissions are severely out of range versus peers. If the model doesn’t sync, more investigation is needed.
Analysts can also leverage active engagement to encourage company management teams to report data according to industry standards. More consistent reporting will make it possible to audit results—a capability we think is essential in the long run. Analysts can also adjust data to better represent a company’s actual situation.
However, approximating transition and location risks has to be done with great care, particularly as we consider tipping points and cascading events. Both temperature and time-until-action are exponential variables, so small misses in data intensity can mean extreme differences in outcomes. A one-degree temperature rise has a much different effect than a 10-degree rise. Or, in the case of wind strength, a 10-mph wind might be benign, but just one more tick upward on an exponential scale leads to a 100-mph wind that can wreak widespread havoc.
Case Study: Is the Business Dirty…or Just the Data?
A brief case study provides a glimpse into the nuances of integrating climate modeling into fundamental research. Companies with carbon-dense operations, such as trash collection and disposal, score exceptionally high in transition risk, but they’re also helping clean up the mess others are making.
Waste-management companies Clean Harbors and Republic Services may generate a lot of carbon today, but their entire business models center on cleaning the environment. For every ton of greenhouse gas Clean Harbors generates from operations, it avoids another two tons. Republic Services is on Barron’s 100 Most Sustainable Companies list and CDP Worldwide’s Climate A List. Republic Services has also pledged to reduce its Scope 1 emissions 35% by 2030 and has launched a landfill-gas-to-renewable-gas project that promises to send 50% more landfill gas to beneficial reuse by 2030.
We believe that climate scenario models must evolve to better frame these types of companies—that means relying on more than patents and green revenue.
Case Study: The Biggest Risks Might Also Be Big Opportunities
Some believe that investors seeking lower portfolio CVaR should focus their investments on companies with low physical and transition risks. Many managers already do this, but we think that approach is shortsighted.
Sizable opportunities exist among companies that face large transition risks but are doing the right things to improve. In fact, we believe that investing in such brown firms and industries is critical, because they’ll be essential to the clean-energy transition. Investing in these companies also allows us to engage with management as the firms navigate climate change, giving us better insight into their strategies and potential risks.
The utility industry fits this mold. In 2020, approximately 61% of electricity generated in the US came from fossil fuels. In order to meet sustainability goals, that number must come down. NextEra Energy, parent company of Florida Power & Light, is playing a part in that effort. The largest retail electricity producer in the US, NextEra is also the world’s largest wind and solar power generator—and a Fortune Top 20 Global Innovator. Despite doubling its power generation, the company has committed to reducing greenhouse gas by 40% from 2005 levels by 2025. Not to mention its 50 hydrogen projects underway and current power generation that’s 25% sourced from renewables—and growing.
Case Study: Physical Risks Could Change Dining Habits
When considering physical climate-change risks, much of the discussion has centered on rising sea levels and coastal flooding. But recent output from our scenario analysis of a sample portfolio tracking global indices flagged another factor. The effect of extreme heat on protein producers is creating some of the largest CVaR. Two of the five biggest outliers, in fact, were protein producers, and in our assessment, the data are solid. As temperature rises, it takes more resources to raise livestock—including feed, electricity and water. Plus, protein producers have yet to optimize current breeds and herds for a warmer climate.
It’s not just livestock affected by extreme heat—it’s the entire hamburger supply chain. Almost 75% of soybeans become animal feed, and extreme heat weakens crop yields and drives feed costs higher. The full implications of potential effects and costs are still being uncovered. So far, less than 5% of meat companies have disclosed climate scenario analysis; by comparison, 23% of oil and gas, mining and utility companies have done so.
The Future of Climate Scenario Analysis
Collaborating with a provider of climate scenario analysis enhances the investment process, despite the challenges of working with imperfect data. Providers collect unstructured data in a central location from various sources, and available models cover everything from temperature change to financial impact.
But the industry is young—and a lot of refining is needed to make scenario analysis a more effective tool for investment decision¬–making. Risk and opportunity models are complex, but they still need more complex interactions. Today, for example, transition and physical risks are often calculated separately and don’t interact. Over time, we envision general (global) circulation models that funnel down to a regional economic impact model, then finally drill down to corporate earnings and valuations. But a model like that would have many assumptions at each stage, which could delay development.
Integrating scenario analysis with the experience and expertise of fundamental research will speed the process of refining the tools. Early adopters can help shape this evolution, working with providers to fine-tune everything from models to data. While progress has been significant in a short time, more is needed. Effective scenario analysis will certainly benefit investors and can improve outcomes.
Related: ESG Ratings Are Going to Be in Spotlight This Year
* The climate scenario analysis business has adopted CVaR to mean climate value at risk. It reflects the expected net portfolio loss from physical risk, transition risk and climate opportunities for a specific scenario. This differs from another meaning of CVaR—conditional value at risk—which quantifies the amount of tail risk within an investment portfolio, or the average expected return for returns below a specified percentile of the distribution of returns. For instance, a 10% conditional value at risk is the average loss from returns in the bottom decile of a distribution.