
Trending

Get the charts. Subscribe to the Market Intel Exchange.
Consumer sentiment and subsequent S&P returns
What this chart shows:
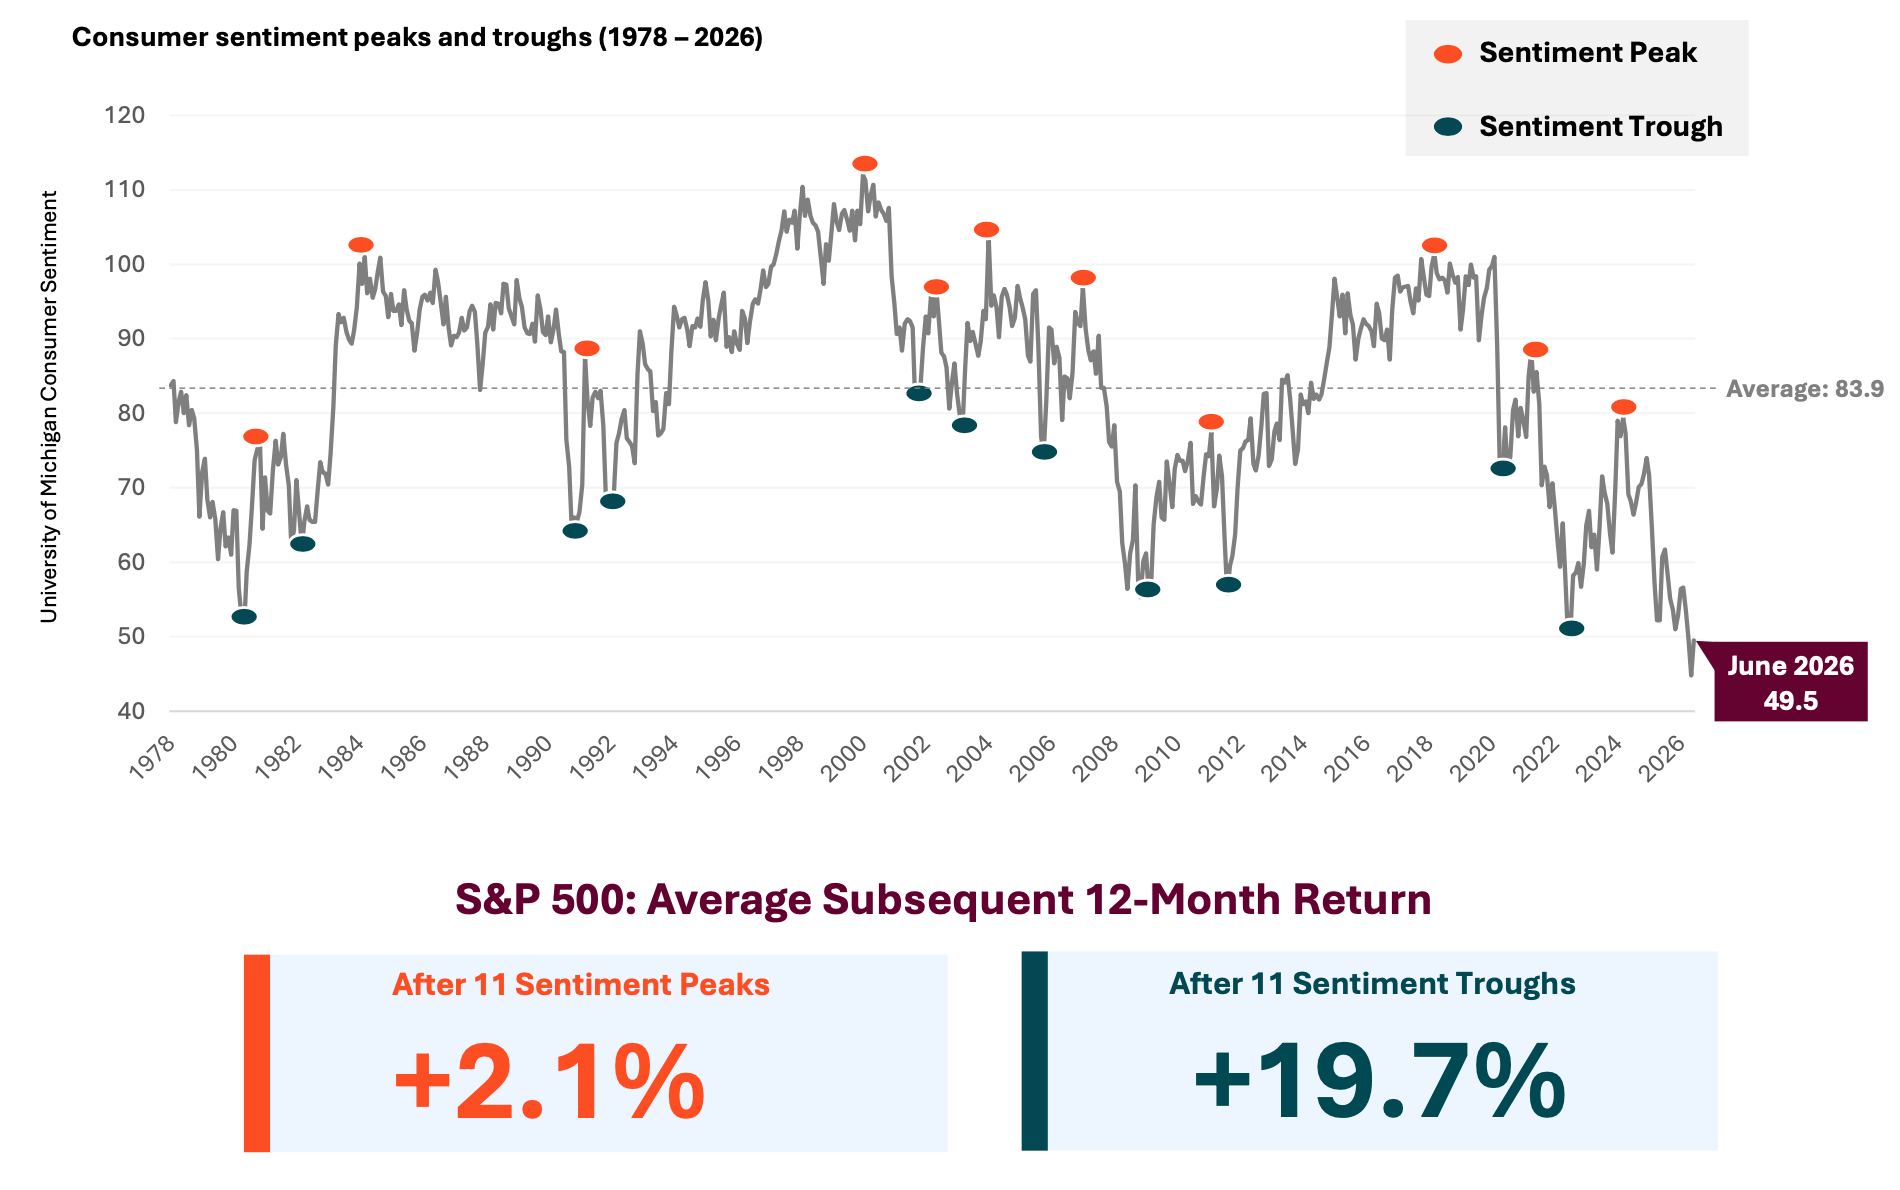
Monthly readings of the University of Michigan Consumer Sentiment Index since 1978. Peaks and troughs in sentiment are marked, and the boxes below show what the S&P 500 returned, on average, in the 12 months following each.
Why it matters:
When Americans are pessimistic about the economy, markets have historically rewarded those who stayed invested.
After the 11 deepest sentiment troughs, the S&P 500 averaged a gain of 19.7% over the next 12 months. That’s nearly 10x the average gain of 2.1% that has followed peaks in sentiment.
Historically, fear has been a setup for markets, not a stopping point.
Source: Morningstar, Federal Reserve Bank of St. Louis, University of Michigan, Lincoln Financial analysis. University of Michigan Consumer Sentiment Index (UMCSENT, monthly), January 1978– June 2026. Peaks and troughs are alternating sentiment extremes, each separated by a ≥15-point reversal. Forward 12-month returns use S&P 500 month-end levels, price-only. Past performance does not guarantee future results. Index performance is for illustrative purposes only. You may not invest directly in an index.
Related: IPO vs. S&P 500: The Surprising Performance Gap Investors Should Know