
Trending

Get the charts. Subscribe to the Market Intel Exchange.
Tech valuations have been driven by fundamentals
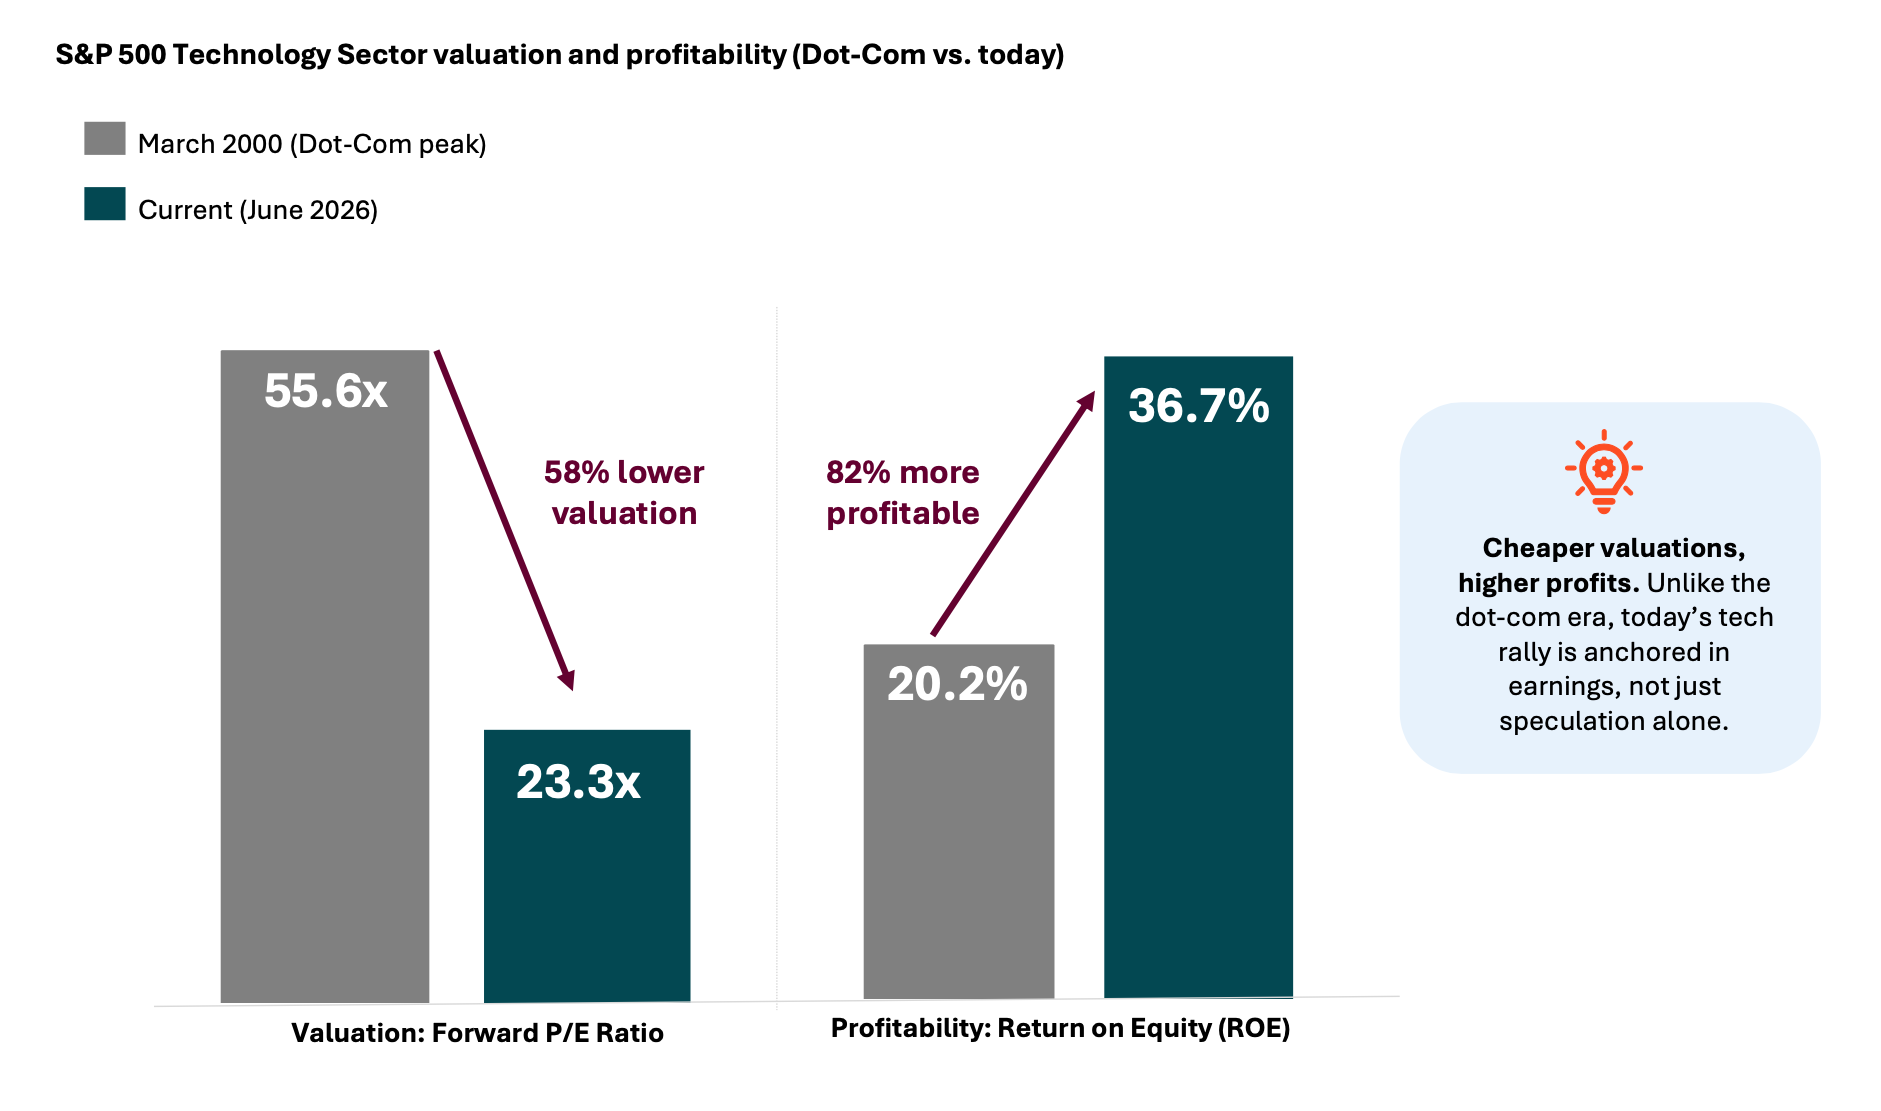
What this chart shows:
This chart compares the S&P 500 Technology Sector in March 2000 (dot-com peak) to today's tech landscape across two dimensions: valuation multiples (forward P/E) and profitability (return on equity).
Why it matters:
Today's tech sector trades at a 58% lower valuation than the dot-com peak while generating 82% higher profitability, suggesting outperformance has been anchored in earnings power, not speculation.
However, concentration remains a vulnerability. The weight of the tech sector in the index stood at 19.2% in March 2000, but it has risen to more than 38% today. If growth expectations shift, valuations can contract rapidly regardless of profitability.
This concentration matters because portfolio outcomes are increasingly dependent on a narrow set of winners. A meaningful pullback in tech valuations would have outsized impact on overall returns, making diversification across sectors and geographies a prudent consideration in 2026.
Source: FactSet, data as of 6/30/2026. March 2000 = dot-com peak on March 11, 2000. Forward P/E (next 12 months) and ROE (last 12 months).
Related: IPO vs. S&P 500: The Surprising Performance Gap Investors Should Know