
Trending

Get the charts. Subscribe to the Market Intel Exchange.
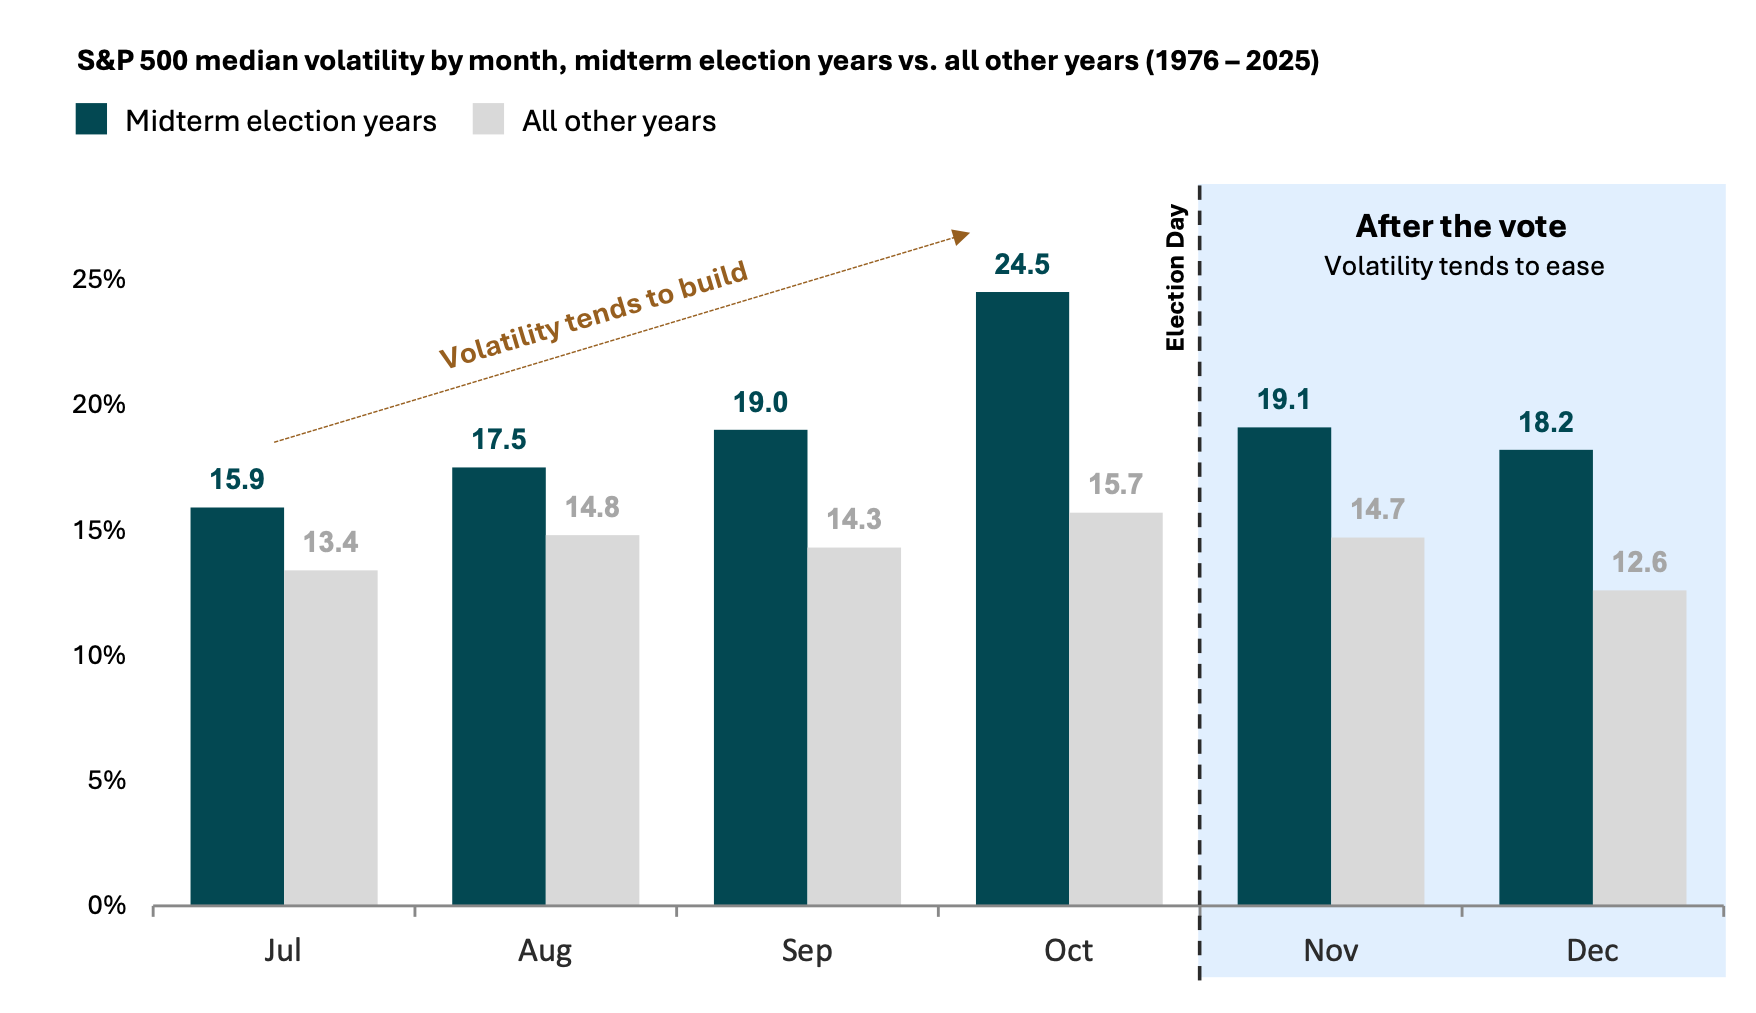
Midterm years have seen volatility build leading up to the election
What this chart shows:
This chart compares the S&P 500's median volatility from July to December by month in midterm election years against all other years from 1976 to 2025.
Why it matters:
The run-up to a midterm election has historically been bumpy.
Volatility tends to build through late summer and fall, peaking around October, and has run well above what’s been seen in ordinary years.
The encouraging news is that once the results are in and uncertainty clears, choppiness has tended to ease through year-end.
For investors, the lesson is not to panic if the noise picks up before the vote. History says that it usually passes, and long-term investors tend to be rewarded for staying the course.
Source: Morningstar, analysis by Lincoln Financial. Median standard deviation of daily returns by month in midterm election years vs. years without a midterm election. Analysis as of 12/31/2025. Federal Election Day falls on the Tuesday after the first Monday in November; the dashed marker approximates its position on a monthly chart. November is classified as a post-election ("after the vote") month. Past performance does not guarantee or predict future performance.
Related: What History Says About Stocks After Midterm Years