
Trending

Get the charts. Subscribe to the Market Intel Exchange.
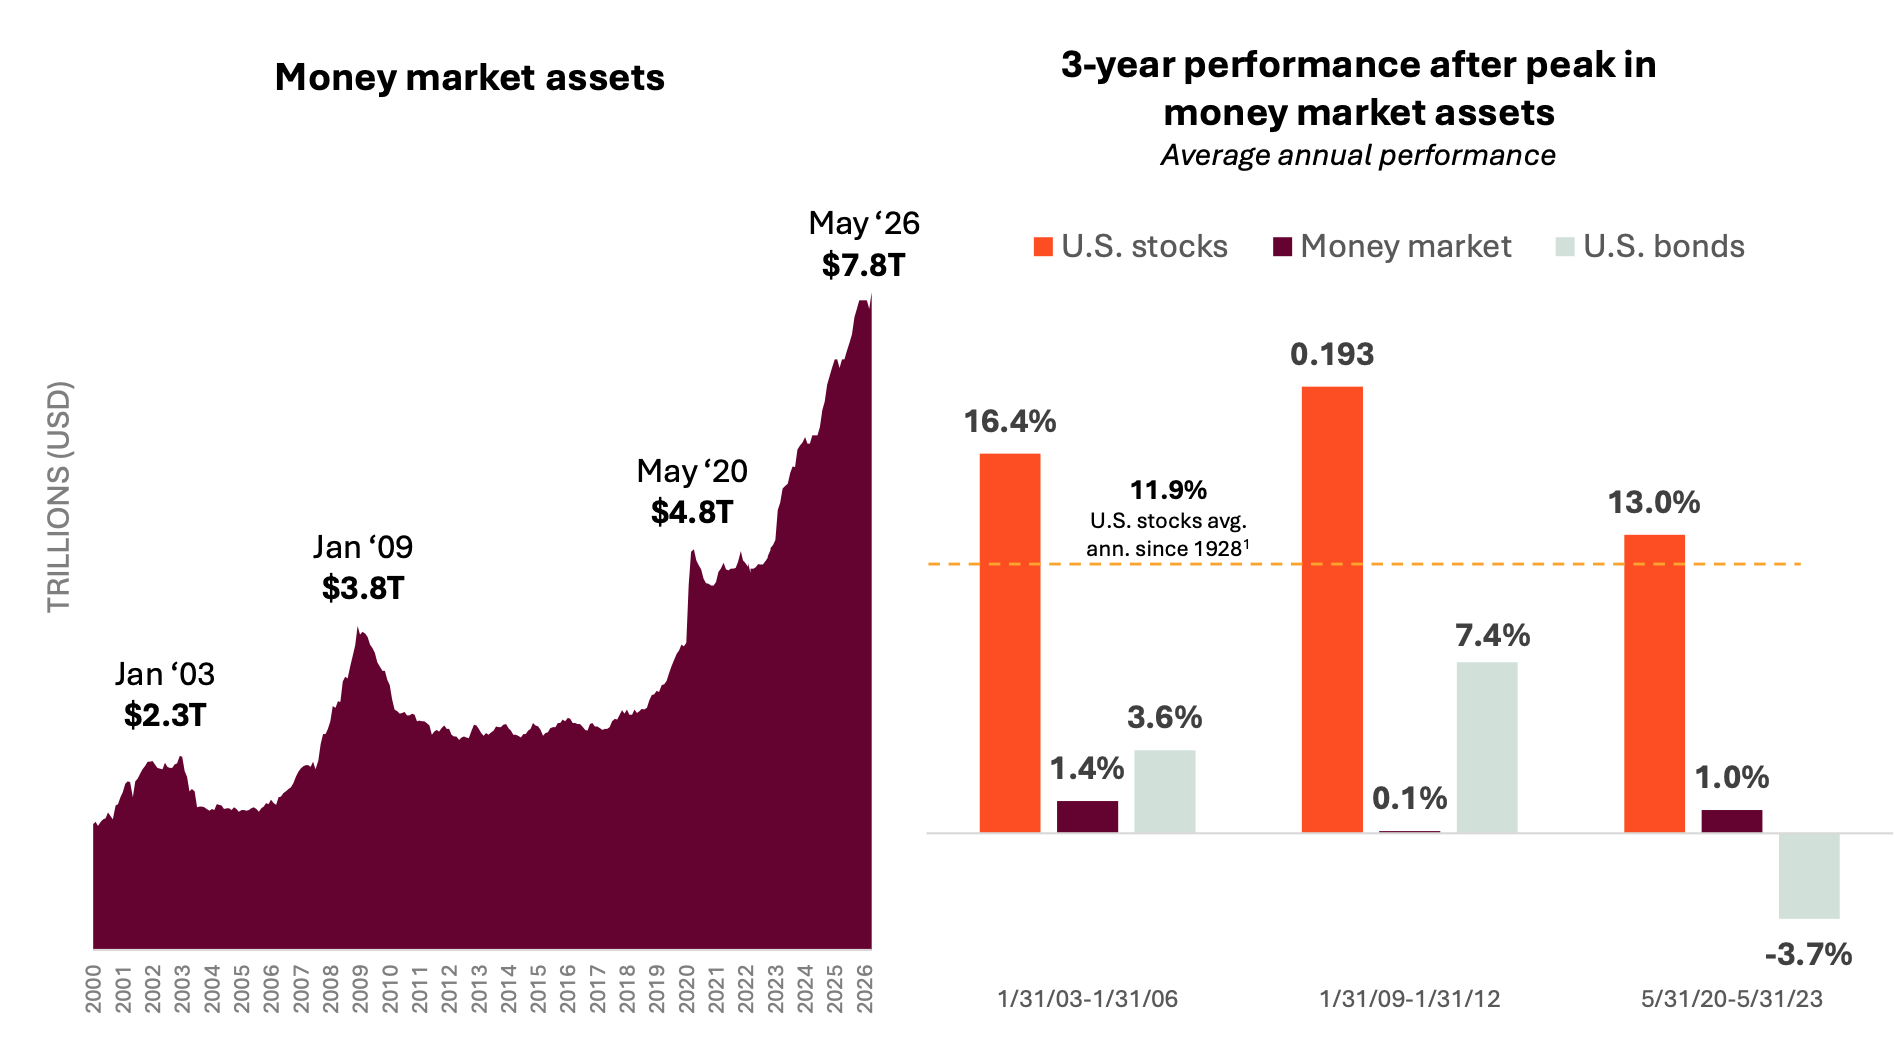
Returns following money market asset peaks
What this chart shows:
This chart shows the rise in money market assets over time, and how money markets and U.S. stocks performed over the three-year period following peaks in money market assets.
Why it matters:
While it can be beneficial for investors to hold cash for preservation or liquidity purposes, holding too much can lead to suboptimal results.
Money market fund assets have continued to reach all-time highs in 2026.
Historically, this has been a bullish sign for stocks as they have performed better than average following periods of peak money market assets.
Source: Chart (left): Morningstar. Data most recently available as of 6/30/26. Chart (right): Morningstar, (1) NYU Stearns historical returns on stocks, bonds and bills accessed on 6/30/2026 S&P 500 total return including dividends, Lincoln Financial. Returns calculated from end of peak month listed. US Stocks = S&P 500 TR; Money Market = Morningstar taxable money market category average returns; US bonds = Bloomberg U.S. Aggregate Bond TR. Past performance does not guarantee or predict future performance. Index performance is for illustrative purposes only. You cannot invest directly in the index.
Related: New All-Time Highs Are Not a Bad Time to Invest