
Trending
Get the charts. Subscribe to the Market Intel Exchange.
S&P 500: Don’t fear all-time highs
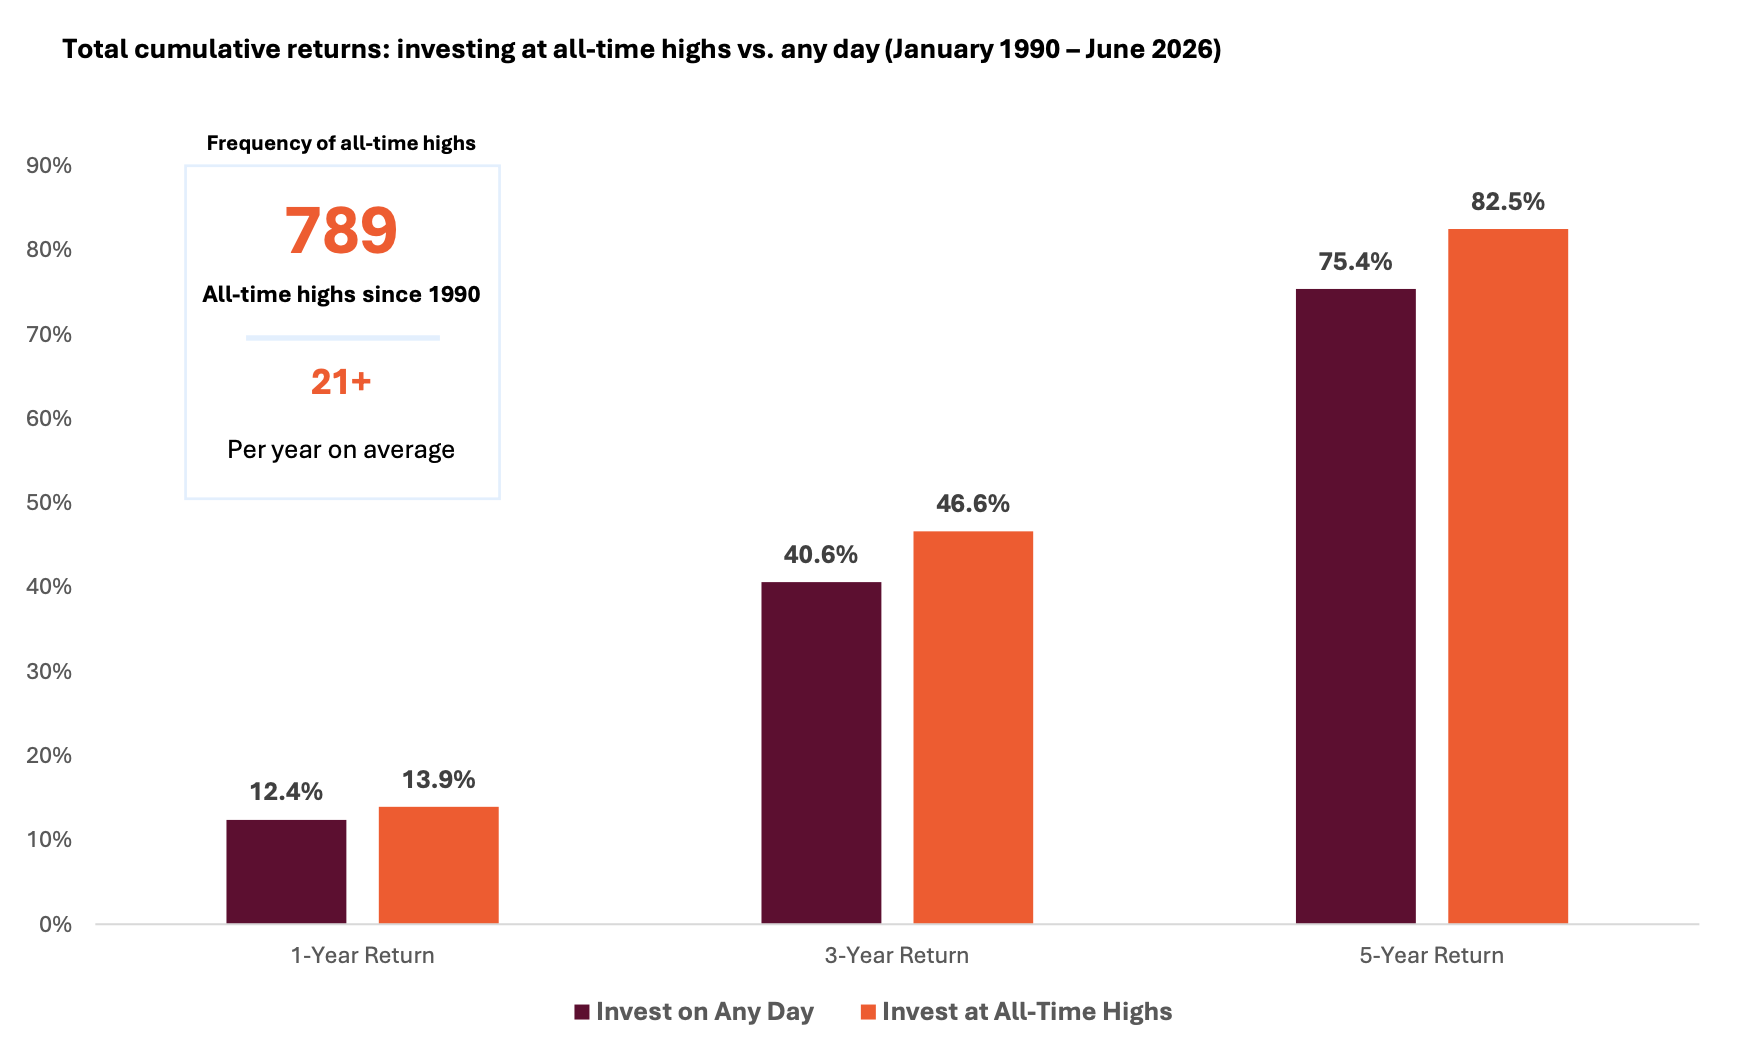
What this chart shows:
The average total return of the S&P 500 over the next 1, 3, and 5 years, comparing two approaches: investing on any trading day versus investing only on days the market closed at a new all-time high.
Why it matters:
New highs feel like a risky moment to invest, and the instinct may be to wait for a pullback.
However, history says the opposite. Since 1990, money invested at an all-time high has, on average, outpaced money invested on any day across each horizon measured: 13.9% vs. 12.4% over one year, 46.6% vs. 40.6% over three years, and 82.5% vs. 75.4% over five.
Source: Morningstar, analysis by Lincoln Financial. S&P 500 price return index used to identify all-time highs, total return (including dividends) used for 1, 3, and 5-year returns (January 1990-June 2026). Number of all-time highs since 1990 includes the current year count, average per year is through most recent year-end. Past performance does not guarantee or predict future performance. You cannot invest directly in an index.
Related: When Consumer Confidence Crashes, Stocks Have Historically Rallied