
Trending

Consumer confidence and subsequent S&P returns
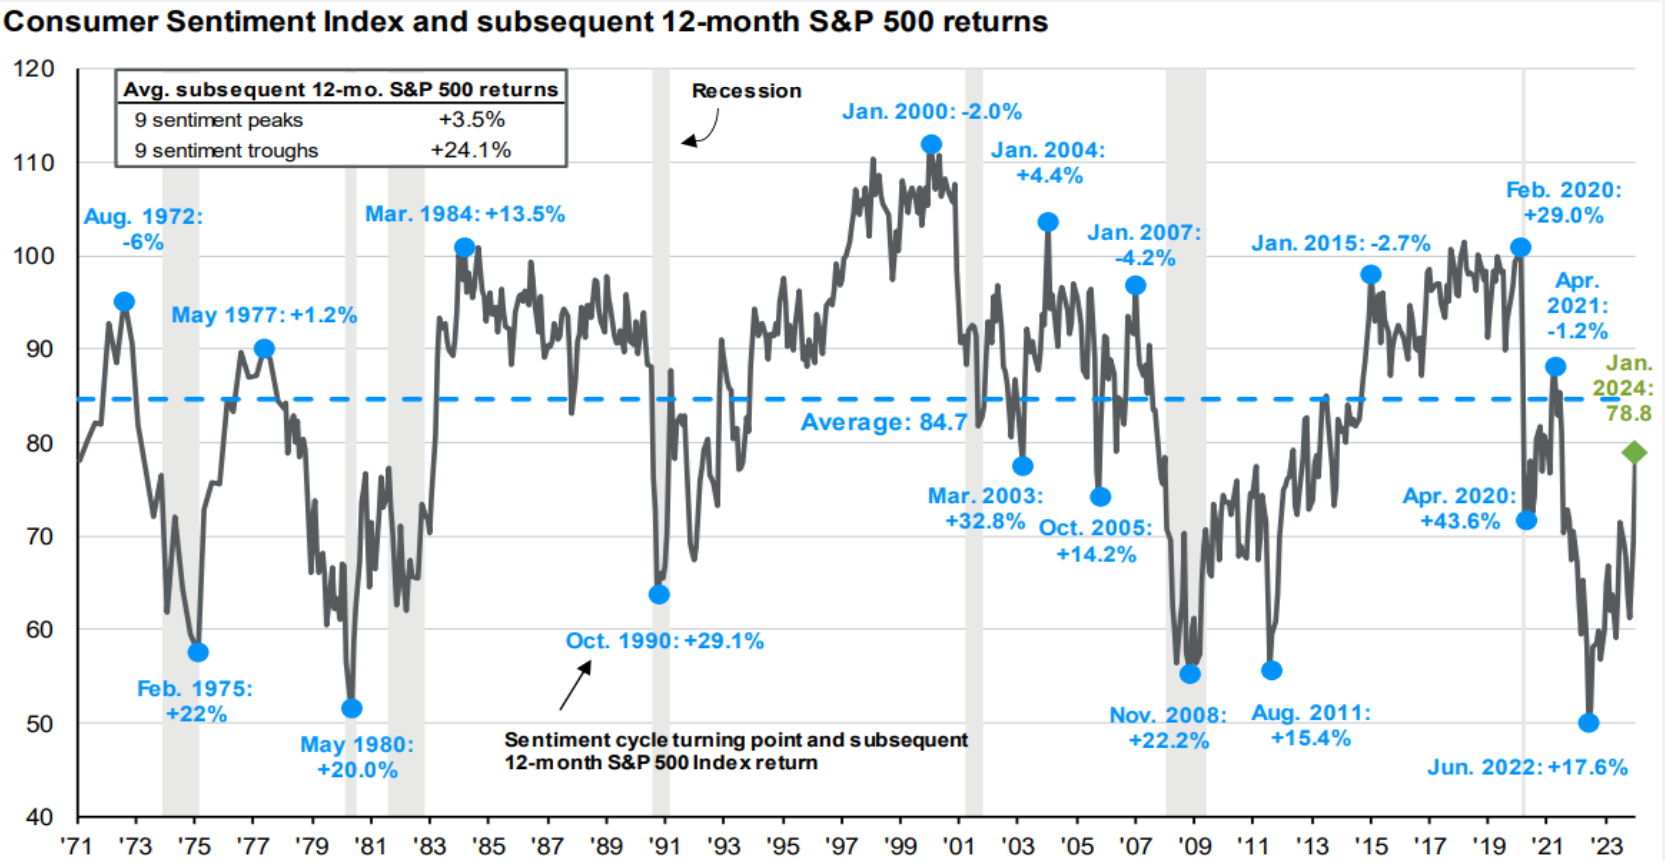
This chart shows consumer sentiment over the past 50 years and how much the S&P 500 gained or lost on average 12 months after nine distinct peaks and troughs. Buying at a confidence peak returned on average 3.5%, while buying at a trough returned 24.1%.
This underscores that when investors feel gloomy and worried about the outlook, history shows they should consider resisting the temptation to sell risk assets.
Related: Analyzing the Cycles of U.S. Equity Outperformance
Source: FactSet, Standard & Poor’s, University of Michigan, J.P. Morgan Asset Management.
Peak is defined as the highest index value before a series of lower lows, while a trough is defined as the lowest index value before a series of higher highs. Subsequent 12-month S&P 500 returns are price returns only starting from the end of the month and excluding dividends. Past performance is not a reliable indicator of current and future results.
Guide to the Markets – U.S. Data are as of January 31, 2024.
Past performance does not guarantee or predict future performance. Index performance is for illustrative purposes only. You cannot invest directly in the index. Source: J.P. Morgan Asset Management, as of January 31, 2024.