
Trending

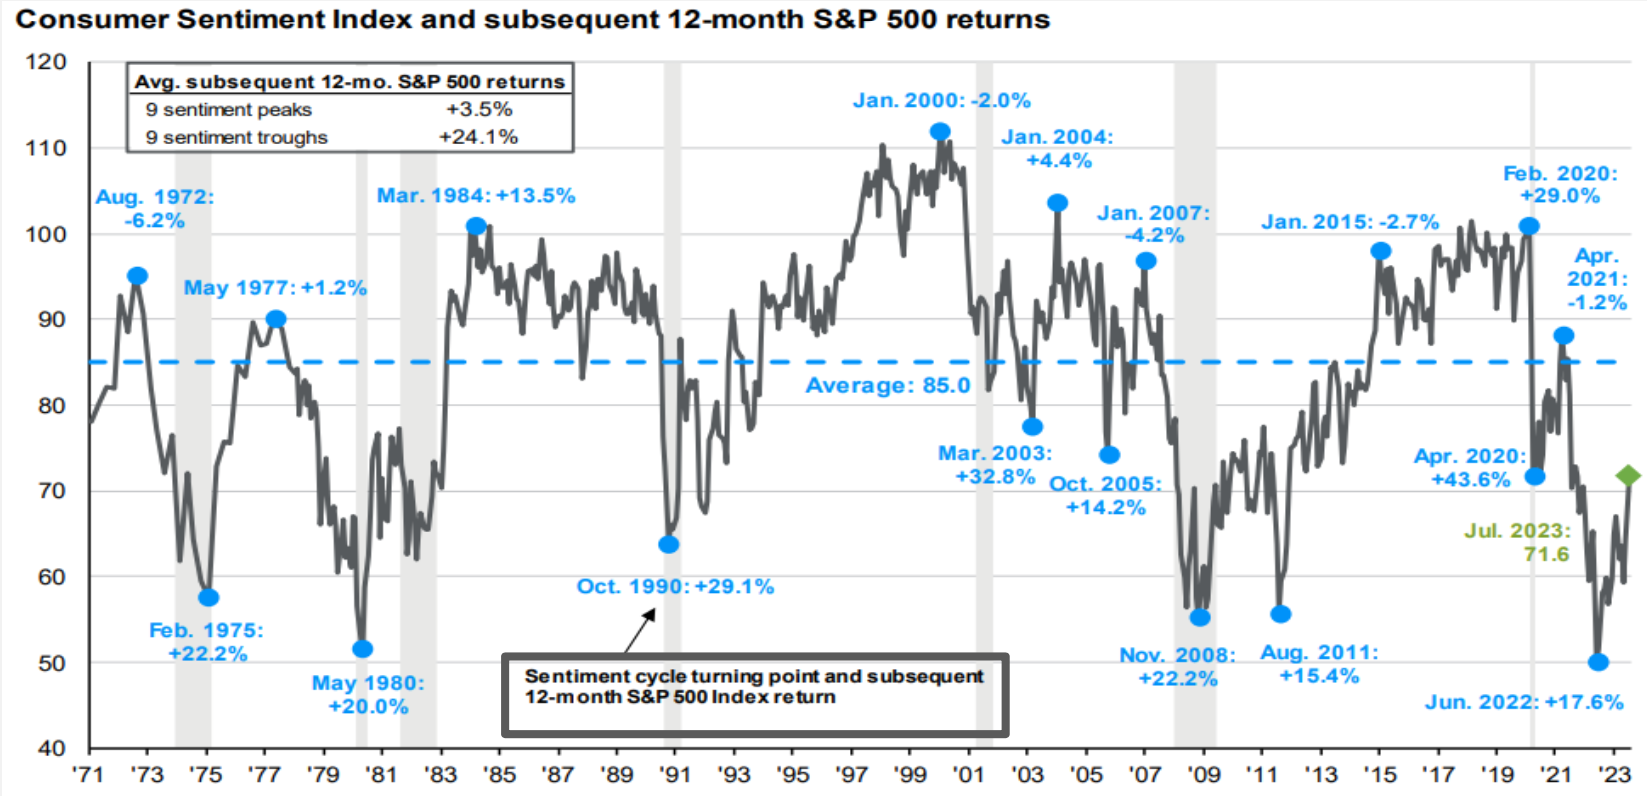
What is this chart showing?
This chart shows consumer sentiment over the past 50 years and how much the S&P 500 gained or lost on average 12 months after eight distinct peaks and troughs. Buying at a confidence peak returned on average 3.5%, while buying at a trough returned 24.1%.
Why is this important?
This underscores that when investors feel gloomy and worried about the outlook, history shows they should consider resisting the temptation to sell risk assets.
Source: FactSet, Standard & Poor’s, University of Michigan, J.P. Morgan Asset Management. Peak is defined as the highest index value before a series of lower lows, while a trough is defined as the lowest index value before a series of higher highs. Subsequent 12-month S&P 500 returns are price returns only starting from the end of the month and excluding dividends. Past performance is not a reliable indicator of current and future results.
Guide to the Markets – U.S. Data are as of July 31, 2023.
Source: JP Morgan, as of July 31, 2023.
LCN-5792016-070623