
Trending

Written by: Przemyslaw Radomski, CFA
Gold
Gold had a good day yesterday, but as it hits the $1,770 resistance line, it will be anything but easy for the yellow metal. The real test has begun.
And so, it happened. Gold moved right to its target level that seemed to be the max that it could reach, but that didn’t seem to be the most likely outcome. Just because it wasn’t the most likely outcome, doesn’t make it impossible. The “most likely” can happen all the time – after all its only “most likely” not “certain” or “inevitable”.
Gold declined right after its triangle-vertex-based reversal, but it appears that the market participants didn’t want to give up on the bullish tone until gold finally reached its previous lows and highs.
Just like magnets, the strong support and resistance lines draw investors and traders, and it seems that we saw this play out once again.
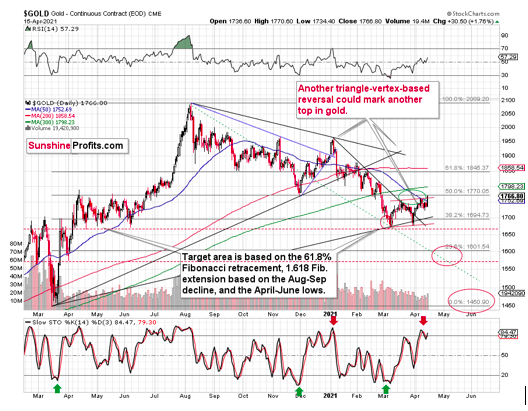
Gold moved slightly above its upper border of the near-perfect flag (zigzag) pattern and this small breakout is not completed. This particular breakout is not even close to being as important as the fact that the previous very strong resistance held yesterday (Apr. 15).
Why? Because the level that was just reached – the $1,770 level – is the level that provided strong resistance in mid-2020 (several times) and it provided strong support in late-2020 and early 2021. These were mostly very important reversals, which make this price level particularly important.
Moreover, the current move higher to this level is symmetrical to what we saw in mid-2020. Consequently, even though this week’s rally might seem like a game-changer, it very likely isn’t one.
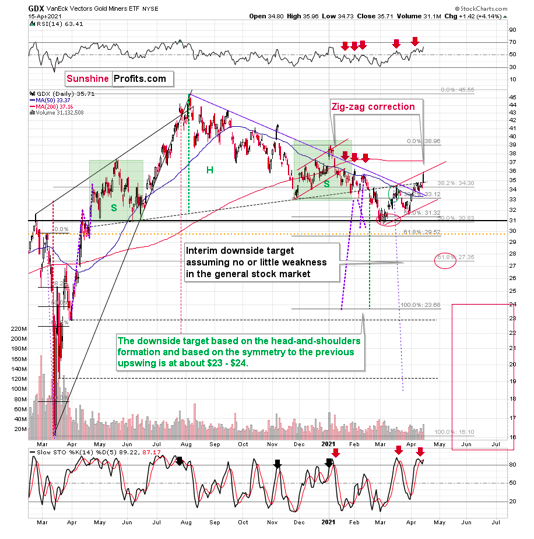
But miners moved higher, and they invalidated the breakdown below the neck level of the broad head-and-shoulders formation!
…Did they, though?
Mining Stocks: GDX and GDXJ
The GDX ETF did indeed close yesterday above the dashed line that I used to mark the neckline of the head and shoulders pattern. One might view this as an invalidation of the breakdown, and thus a bullish sign. This doesn’t add up with gold’s inability to move above its critical resistance at $1,770, and we see that miners moved only to the line that’s symmetrical to the line based on the recent bottoms.
In yesterday’s intraday Alert , I wrote the following:
Mining stocks are rallying too, but please note that they only reached their upper border of the zig-zag pattern. Back in early January, this was exactly where the rally had ended. The top formed on huge volume and based on the volume that we already see today, it’s almost certain that the volume for today’s session will be huge – just like what we saw at the January top.
I realize that waiting for the next big slide is exhausting and discouraging, and it’s not easy to hold on to the current trading position. However, the outlook didn’t change, and the situation continues to fit the bearish narrative despite today’s intraday upswing. Consequently, exiting positions now seems not only pre-mature, but actually opposite to what appears to be a good trading move from my point of view. After all one wants to sell or short at the tops and tops can only form after rallies.
The above remains up-to-date. Let’s get back to the reason why this invalidation of the breakdown in the GDX might not really mean the true, meaningful invalidation of the breakdown in miners in general. The reason is that other proxies for the mining stocks sector don’t confirm it.
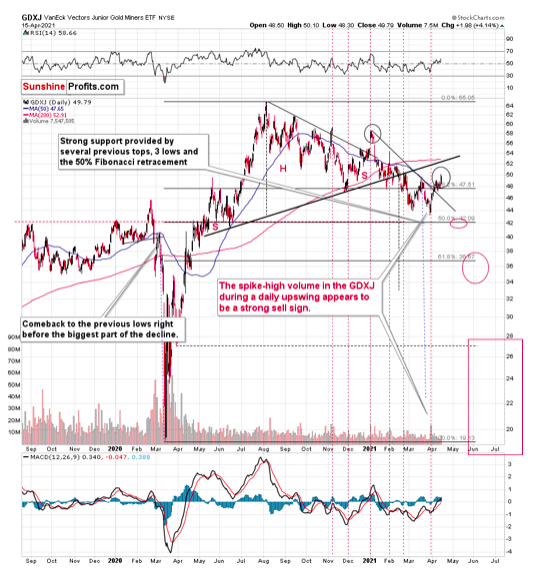
The GDXJ ETF is relatively far from the neck level (which I marked with a thick, black line). On a side note, the breakout that we saw recently (above the short-term declining resistance line) seems similar to the breakout that we saw in January – above the line that was important back then. Just as the January strength turned into declines, I expect to see the same thing this time.
Let’s move to the two key indices for the mining stocks sector, the HUI and the XAU indices .
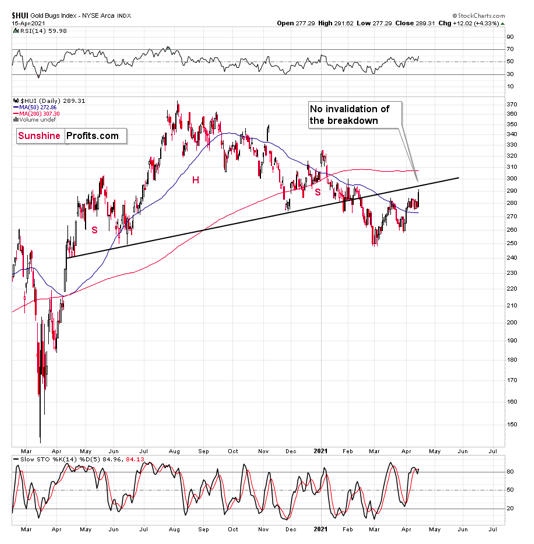
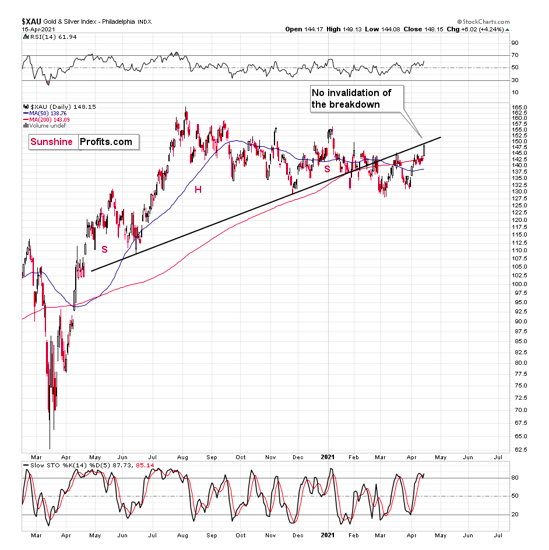
In neither of them did we see the invalidation of the breakdown. Consequently, the GDX ETF is the odd one out in the entire pack, not to mention the lack of a breakout in gold. Therefore, it seems prudent not to give particular meaning to what happened in the GDX ETF alone.
Silver
And what about silver’s outlook ?
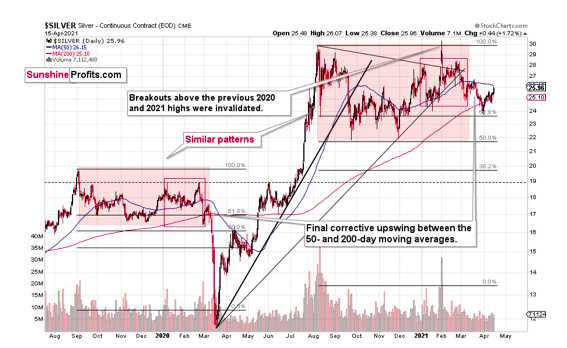
Nothing really changed despite yesterday’s strength. Just as was the case in March 2020, silver is correcting after a visible decline. Back in March 2020, the correction ended between the 200-day (red) and 50-day (blue) moving averages. The same is happening right now. Silver’s 50-day moving average is currently at $26.15 and the white precious metal closed at $25.96.
All in all, it seems that quite a lot happened yesterday, but nothing really changed as far as the outlook for gold is concerned.
Related: Does Gold Want to Move Lower?
The views and opinions expressed in this article are those of the contributor, and do not represent the views of IRIS Media Works and Advisorpedia. Readers should not consider statements made by the contributor as formal recommendations and should consult their financial advisor before making any investment decisions. To read our full disclosure, please click here.