
Trending

Powell’s recent dovish remarks started a sugar high among investors. However, it seems like the hangover has already begun.
The Gold Miners
While gold, silver and mining stocks jumped for joy following Fed Chairman Jerome Powell’s dovish remarks on Jul. 28, their sugar high ended on Jul. 30. And while I warned that FOMC press conferences often elicit short-term bursts of optimism, it was likely another case of ‘been there, done that.’
I wrote prior to the announcement:
While the PMs may record a short-term bounce – which often occurs following Powell’s pressers – lower lows are still likely to materialize in the coming months.
In the meantime, though, did you notice the tiny buy signal from the HUI Index’s stochastic indicator? And taking that into consideration, is it time to shift to the long side of the trade? Well, for one, it seems very likely that gold miners are declining similarly to how they declined in 2008 and 2012-2013. In both cases, there were local corrections within the decline. As a result, the recent strength does not justify adjusting our short positions in the junior mining stocks, and I continue to view them as prudent from the risk to reward point of view.
Second, after the HUI Index recorded an identical short-term buy signal in late 2012 – when the index’s stochastic indicator was already below the 20 level (around 10) and the index was in the process of forming the right shoulder of a huge, medium-term head-and-shoulders pattern – the HUI Index moved slightly higher, consolidated, and then fell off a cliff.
Please see below:
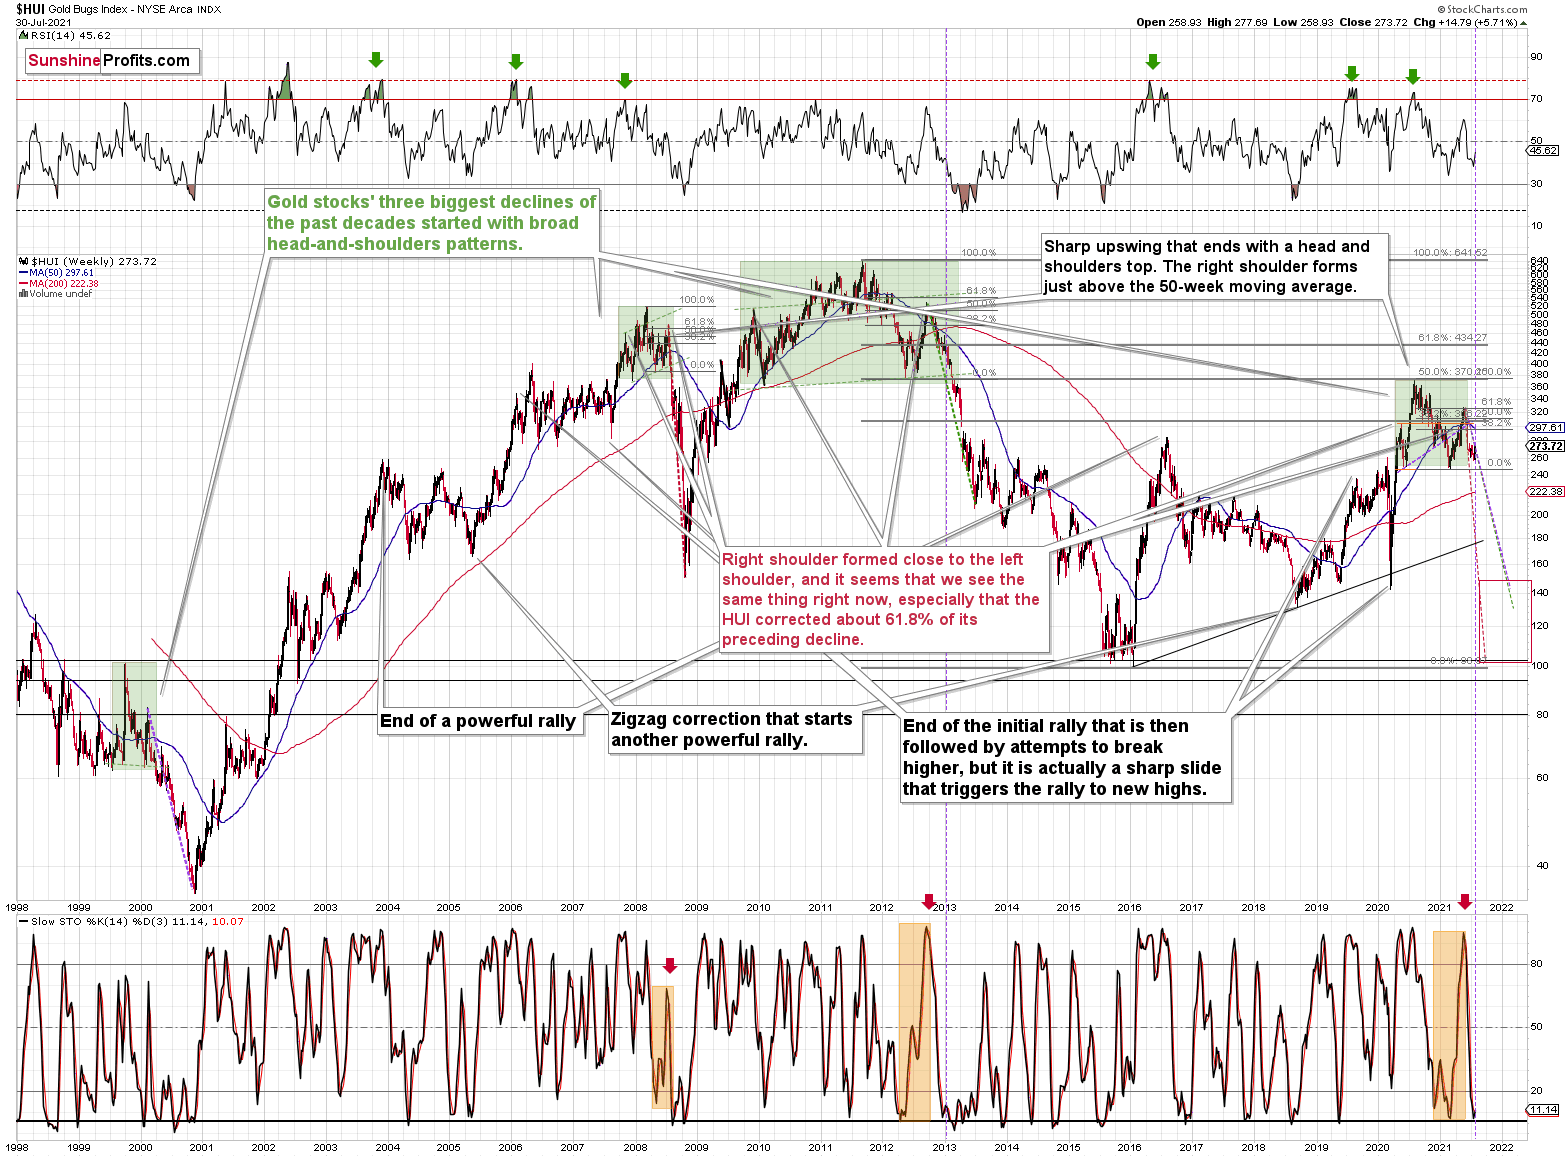
Can you see the HUI’s rally at the end of 2012 that followed a small buy signal from the stochastic indicator? I marked it with a purple, dashed line.
No? That’s because it’s been practically nonexistent. The HUI Index moved higher by so little that it’s impossible to see it from the long-term point of view.
With the shape of gold’s recent price action, its RSI, and its MACD indicators all mirroring the bearish signals that we witnessed back in December 2012, the current setup signals that we’re likely headed for a similar swoon. Thus, with both gold and the HUI Index sounding the alarm, if the bullish momentum continues, it’s likely to be very limited in terms of size and duration. Conversely, the following slide is likely to be truly profound.
For context, I warned previously that the miners’ drastic underperformance of gold was an extremely bearish sign. I wrote the following about the week beginning on May 24:
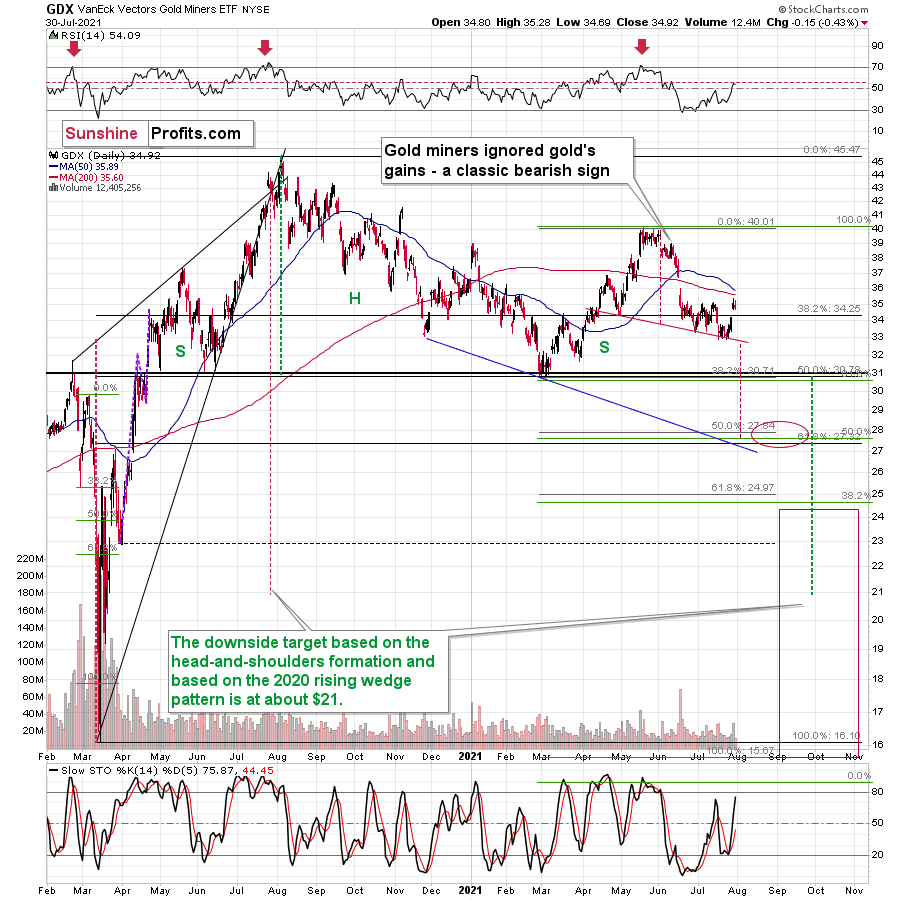
(…) gold rallied by almost $30 ($28.60) and at the same time, the HUI – a flagship proxy for the gold stocks… Declined by 1.37. In other words, gold stocks completely ignored gold’s gains. That shows exceptional weakness on the weekly basis and is a very bearish sign for the following weeks.
If it wasn’t extreme enough, we saw this one more time. Precisely, something similar happened during the week beginning on July 6. The gold price rallied by $27.40, and the HUI Index declined by 1.39.
Likewise, with the HUI Index’s ominous signals still present, if history rhymes (as it tends to), medium-term support will likely materialize in the 100-to-150 range. For context, high-end 2020 support implies a move back to 150, while low-end 2015 support implies a move back to 100. And yes, it could really happen, even though such predictions seem unthinkable.
In addition, the drastic underperformance of the HUI Index also preceded the bloodbath in 2008. To explain, right before the huge slide in late September and early October, gold was still moving to new intraday highs; the HUI Index was ignoring that, and then it declined despite gold’s rally. However, it was also the case that the general stock market suffered materially. If stocks didn’t decline back then so profoundly, gold stocks’ underperformance relative to gold would have likely been present but more moderate.
Nonetheless, bearish head & shoulders patterns have often been precursors to monumental collapses. For example, when the HUI Index retraced a bit more than 61.8% of its downswing in 2008 and in between 50% and 61.8% of its downswing in 2012 before eventually rolling over, in both (2008 and 2012) cases, the final top – the right shoulder – formed close to the price where the left shoulder topped. And in early 2020, the left shoulder topped at 303.02. Thus, three of the biggest declines in the gold mining stocks (I’m using the HUI Index as a proxy here) all started with broad, multi-month head-and-shoulders patterns. And in all three cases, the size of the declines exceeded the size of the head of the pattern.
Furthermore, when the HUI Index peaked on Sep. 21, 2012, that was just the initial high in gold. At that time, the S&P 500 was moving back and forth with lower highs. And what was the eventual climax? Well, gold made a new high before peaking on Oct. 5. In conjunction, the S&P 500 almost (!) moved to new highs, and despite bullish tailwinds from both parties, the HUI Index didn’t reach new heights. The bottom line? The similarity to how the final counter-trend rally ended in 2012 (and to a smaller extent in 2008) remains uncanny.
As a result, we’re confronted with two bearish scenarios:
- If things develop as they did in 2000 and 2012-2013, gold stocks are likely to bottom close to their early-2020 low.
- If things develop like in 2008 (which might be the case, given the extremely high participation of the investment public in the stock market and other markets), gold stocks could re-test (or break slightly below) their 2016 low.
In both cases, the forecast for silver, gold, and mining stocks is extremely bearish for the next several months.
As further evidence, let’s compare the behavior of the GDX ETF and the GDXJ ETF. Regarding the former, the senior miners’ (GDX) RSI rose above 50 last week. However, the milestone preceded several corrective tops in 2020 and 2021. Thus, last week’s Fed-induced strength has only broadened the right shoulder of its bearish H&S pattern, and if completed, the size of the head implies a drawdown to roughly $28.
Please see below:
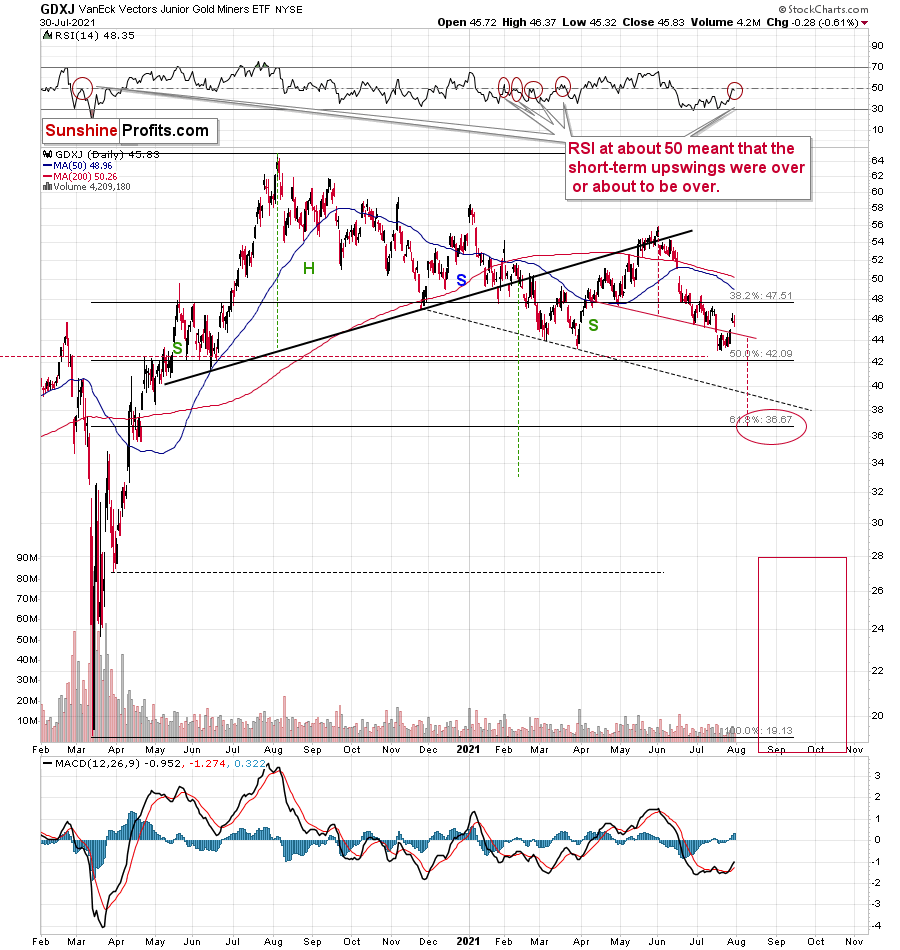
Meanwhile, the GDXJ ETF invalidated the breakdown below the neckline of its bearish H&S pattern last week. However, with the milestone likely a speed bump along the junior miners’ bearish journey, a mosaic of indications signal that their medium-term outlook remains quite somber. For context, with the junior miners’ RSI at 48.35, several flirtations with 50 coincided with the short-term peaks in 2021 and were followed by material declines. I marked these cases with red ellipses. And yes, it was also the case during the final corrective pre-slide upswing in March 2020.
The bottom line?
If gold repeats its June slide, it will decline by about $150. Taking the entire decline into account (since August 2020), for every $1 that gold fell, on average, the GDX was down by about 4 cents (3.945 cents) and GDXJ was down by about 6.5 cents (6.504 cents).
This means that if gold was to fall by about $150 and miners declined just as they did in the past year (no special out- or underperformance), they would be likely to fall by $5.92 (GDX) and $9.76 (GDXJ). This would imply price moves to $27.76 (GDX) and $35.78 (GDXJ).
In conclusion, gold, silver, and mining stocks received a helping hand from the Fed last week, as the charitable contribution uplifted the precious metals. However, while the central bank achieved its objective and talked down the U.S. dollar, prior bouts of short-term optimism faded once reality reemerged. As a result, with the USD Index now in season and the 2012 analogue looking more prescient by the day, gold, silver, and mining stocks will likely suffer profound declines in the coming months. However, with their long-term fundamentals still extremely bullish, new highs will likely dominate the headlines in the coming years.
Related: Gold’s Behavior in Various Parallel Inflation Universes
The views and opinions expressed in this article are those of the contributor, and do not represent the views of IRIS Media Works and Advisorpedia. Readers should not consider statements made by the contributor as formal recommendations and should consult their financial advisor before making any investment decisions. To read our full disclosure, please click here.