
Trending

Uncertainties Abound as Gold Reaches Fresh Highs
Trade tensions have become trade wars and trade wars are threatening to become currency wars. Gold moved to a fresh six-year high of $1,555 per ounce on August 26 as markets reacted to retaliatory threats and actions between the U.S. and China. It looks as if the established superpower and the emerging superpower have begun an economic war for global supremacy. The uncertainty is creating a drag on commerce at a time in the cycle when it might do the most damage to the global economy. At the same time, central banks across the globe are cutting rates in an attempt to offset recessionary forces. As a result, gold has been rising across all currencies as a hedge against economic uncertainty and fiat currency debasement. It has made record local currency highs in Australia, India, Europe (Euro), Japan and many other countries. Gold ended the month with a $106.40 (7.5%) gain at $1,520.30. Silver’s performance was stellar, with a $2.12 (13.0%) gain at $18.38. Gold stocks rose with the metals, as the NYSE Arca Gold Miners Index[1] advanced 11.7%, while the MVIS Global Junior Gold Miners Index[2] gained 8.4%. Higher gold prices have not deterred central banks, as they continued buying in July. They are currently on a pace to exceed the 2018 volumes, which were the second strongest on record. Top buyers in 2019 are Russia, Poland, China, Turkey and India. Trade wars and sanctions are giving emerging countries added incentive to add more gold to their foreign exchange reserves.Don’t Ignore the Warning Signs
The gold price is now consolidating above the $1,500 per ounce level in a similar fashion to the consolidation above $1,400 in July. Futures positioning and strong bullion ETF inflows suggest the market may be due for a pullback. However, given the strong price moves through technical levels since June and the evolving risks of Brexit, trade and economic weakness, the inevitable correction might not happen until gold is trading at substantially higher levels. Chairman Powell’s comments from the Jackson Hole conference on July 31 characterized the U.S. Federal Reserve’s (“Fed”) July rate cut as precautionary, insurance against risks and a mid-cycle adjustment. These reassuring comments remind us of a prior Fed Chairman’s comments ahead of the global financial crisis when we were told that problems in subprime mortgages would stay contained. Market watchers should be concerned by the fact that:- Since 1921 there have been 11 three-month/10-year treasury yield curve inversions that were followed by 11 recessions. And the 12th such inversion began in August.
- With the August U.S. ISM Purchasing Managers’ Index[3] falling to 49.1, the world is officially in a manufacturing recession.
- Not since the 1930s has the Fed ended a rate hiking cycle when the funds rate was just 2.5%.[4]
- In a typical easing cycle, the Fed cuts rates by 5% to 6%, suggesting the U.S. will eventually join Europe and Japan in setting rates below zero.
- Since the 2007 credit bubble high, global debt has increased by $128 trillion to $244 trillion, while global debt/GDP has increased from 98% to 187%. Cutting rates has little efficacy in a world that is already drowning in debt.[5]
- Globally, $17 trillion of bonds now trade at negative yields.[6]
Tracing Historical Trends of Gold and Gold Stocks
A comparison with prior multi-year periods of rising gold prices (or “bull markets”, loosely defined) might lend some insights as to where this market is heading. The chart below compares several gold bull markets from the past half century, classified as either “secular” (long term) or “cyclical” (short term and occurring within an multi-year period of overall declining gold prices or a “bear market”). The gold price performance since 2015 had been tracking the same pattern as the 1993 – 1996 cyclical bull market. However, the price trend since June puts the current market on a trend that is becoming more like the secular bull market from 2001 to 2008 in our view.Gold Performance in Historical Gold Bull Markets
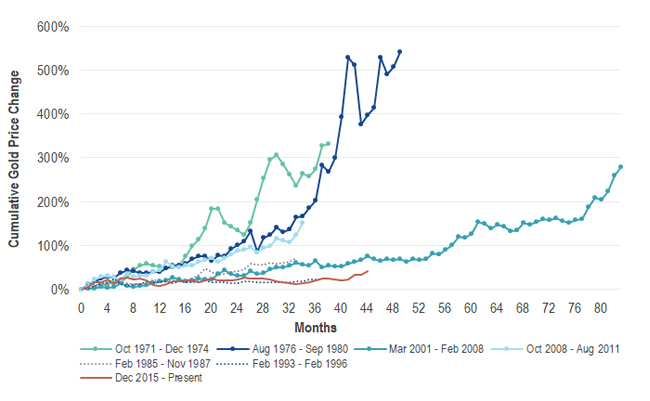
Source: VanEck, Bloomberg. Data as of August 2019. “Gold” represented by Gold Spot ($/oz). Past performance is not indicative of future results.
One of the key drivers of the current gold market is falling real interest rates. With more Fed cuts expected this year, the duration of the current bull market is becoming similar to past secular bull markets. It remains to be seen whether performance will match the 2001 – 2008 market, when the key driver was U.S. dollar weakness. This chart plots the spectacular performance of gold stocks during the 2001 – 2008 bull market:Gold vs. Gold Stocks in March 2001 to February 2008 Gold Bull Market
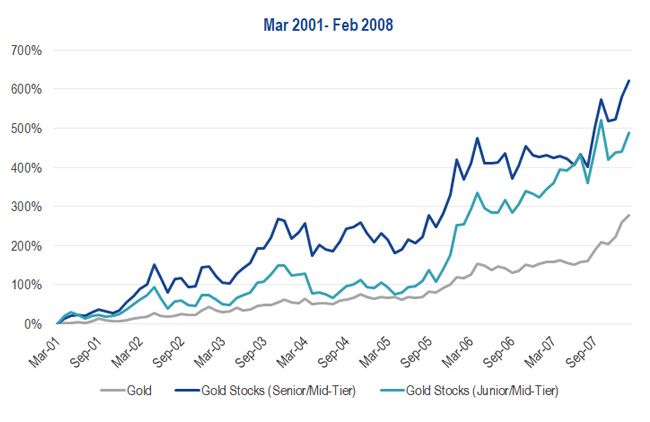
Source: VanEck, Bloomberg. Data as of August 2019. “Gold” represented by Gold Spot ($/oz). “Gold Stocks (Senior/Mid-Tier)” represented by NYSE Arca Gold Miners Index (GDMNTR). “Gold Stocks (Junior/Mid-Tier)” represented by MVIS Global Junior Gold Mining Index (MVGDXJTR). “Senior” miners are defined by production levels of approximately 1.5-6.0 million ounces of gold per year (“Mid-Tier” miners approximately 0.3-1.5 million ounces per year; “Junior” miners approximately <0.3 million ounces per year). Past performance is not indicative of future results. Indices are not securities in which an investment can be made. Index descriptions provided in disclosures below.