
Written by: Gabriela Santos
Fresh in investors’ memories is the recent long cycle of U.S. dollar strength (2012-2022), during which the dollar strengthened 38% versus its trading partners (in real terms). What is often forgotten is that the dollar moves in long cycles of alternating strength and weakness, lasting each on average nine years (since 1978). From September 2022 to January, the dollar weakened over 6%, leaving investors wondering whether we are now on the other side of the mountain: a cycle of dollar weakness. There are reasons to believe so: elevated valuations versus long-term fundamentals combined with a turn in short-term catalysts like growth differentials, interest rate differentials, flows and sentiment. Periods of dollar depreciation have been associated with international equity outperformance – another reason for investors to consider closing their long-standing underweight.
Five factors suggest the dollar may be at the beginning of a cycle of depreciation:
- Expensive starting point vs. fair value: After ten years of strength, the dollar is close to its highest level since 2001 and expensive versus long-term variables that define its “fair value”, such as the current account. In 3Q22, the U.S. recorded a trade deficit of 3.2% of gross domestic product (GDP) (just off the 15-year high deficit of -4.6% in 1Q22).
- Widening growth differentials: From 2012-2022, the rest of the world only grew 0.5 percentage points more than the U.S., a stark difference versus the 2.3 percentage points from 2001-2011. This gap is set to widen again in favor of the rest of the world to 1.2 percentage points over the next five years. This year’s positive upgrades to growth in Europe and China versus rising probabilities of a U.S. recession (especially after the most recent tightening in financial conditions) is a move in that direction.
- Shrinking interest rate differentials: From 2012-2019 and in 2022, interest rate differentials between the U.S. and other countries widened, as the Federal Reserve (Fed) was more hawkish than other central banks. By October, U.S. 10-year yields were 2.2 percentage points higher than other developed markets. Since then, yield differentials shrank to 1.7% as other central banks joined the tightening trend. This gap is set to shrink further should the Fed pause and soon start cutting rates, as seems more likely after the regional banking stress.
- Flows returning to non-U.S. markets: Over the past decade, due to U.S. economic and earnings resilience and higher interest rates, global capital flocked to U.S. markets. However, we seem to be at the beginning of a turnaround given the change in the international growth and interest rate backdrop, together with a potential shift in market leadership.
- Sentiment is key short-term: During risk-off moments, a flight to U.S. safe-haven assets can overwhelm other variables. Since the regional banking stress began, bond volatility has surged. A short-term period of dollar strength versus emerging markets (EM) currencies may follow. Over the past ten days, the U.S. dollar has strengthened 1.3% versus EM currencies. Meanwhile, it has weakened 2.2% versus developed market (DM) currencies (4.0% versus the Yen and 3.5% versus the Pound), as investors search for safety in other reserve currencies.
As with anything, winners and losers emerge when the direction of the dollar changes. A key beneficiary should be U.S. dollar-based investors investing overseas. Previous cycles of dollar weakness have been associated with subsequent international equity outperformance versus U.S. equities. In addition, multinational U.S. companies should benefit as their foreign earnings are worth more when converted back to U.S. dollars. Potential “losers” include multinational foreign companies whose earnings will now receive less of a currency boost than before, as well as U.S. tourists who should enjoy their particularly strong purchasing power overseas while it lasts.
U.S. dollar weakness and international outperformance have historically gone hand in hand
Real broad effective exchange rate, MSCI World ex-U.S. vs. S&P 500*
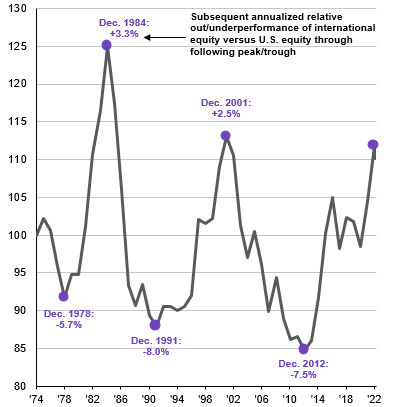
Source: MSCI, J.P. Morgan Global Economic Research, J.P. Morgan Asset Management. *U.S. dollar is the J.P. Morgan Global Economic Research real broad effective exchange rate (CPI) indexed to 100 in 1974. MSCI World ex-U.S. minus S&P 500 for each period of U.S. dollar peak/trough. Data are as of March 21, 2023.